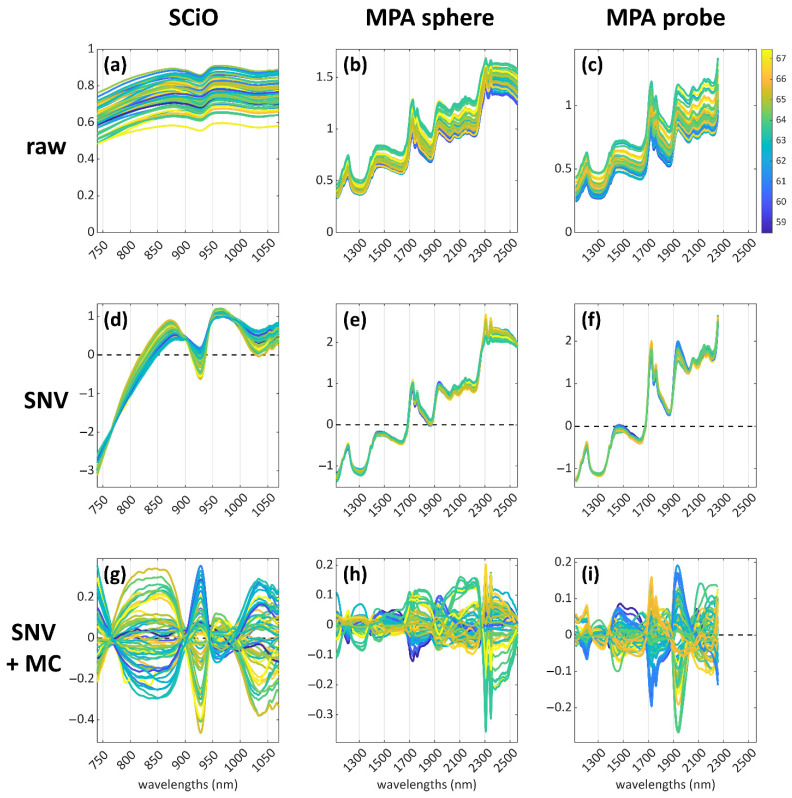
Figure 1.
Visual representation of the data-preprocessing pipeline, declined, according to the three datasets (from top to bottom along each column): raw NIR spectra of the hazelnut samples (a–c); spectra preprocessed with Standard Normal Variate (SNV) (d–f); spectra preprocessed with SNV + mean centering (MC) (g–i).

