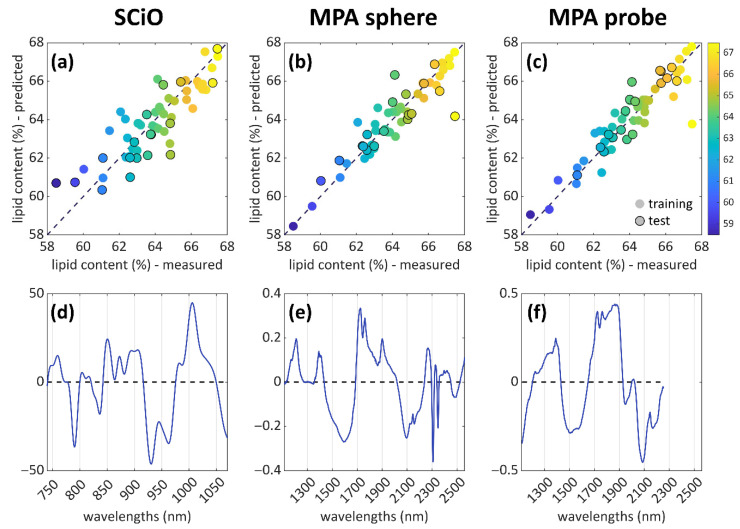
Figure 3.
PLS results for the three analytical techniques of the study. The prediction plots are shown in the first row (a–c), with the samples coloured according to the lipid content. The black-bordered markers correspond to the test set (predicted samples). In the second row (d–f), the corresponding regression vectors are reported, showing the variables that are important for each PLS model.

