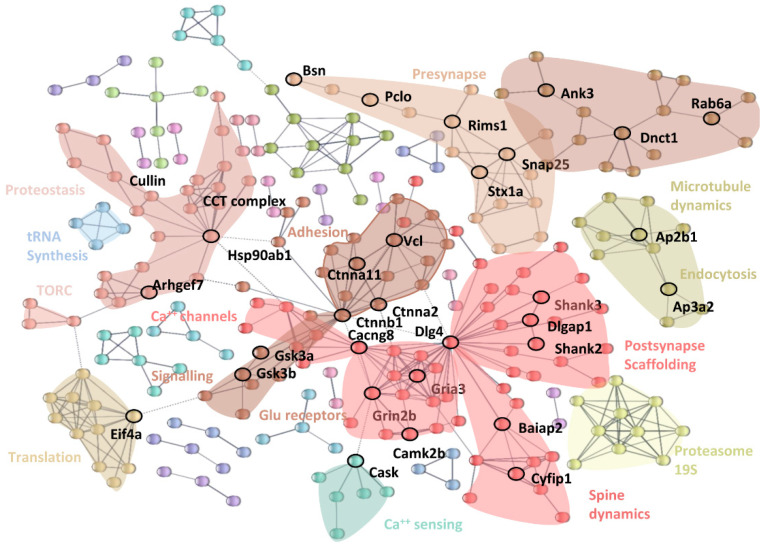
Figure 5.
STRING Interactome of the up-regulated proteins in the contrast RC vs. SC. Each node in the graph represents a protein. Edges represent experimentally proven physical interactions with high confidence. Singletons, i.e., up-regulated proteins whose interactors are not up-regulated, are not displayed. Colors identify different clusters generated by Markov Cluster Algorithm (MCL) with parameter 1.3. Clusters particularly relevant for plasticity are highlighted as convex hulls of a different color and the names of particularly relevant genes/hubs are also displayed.

