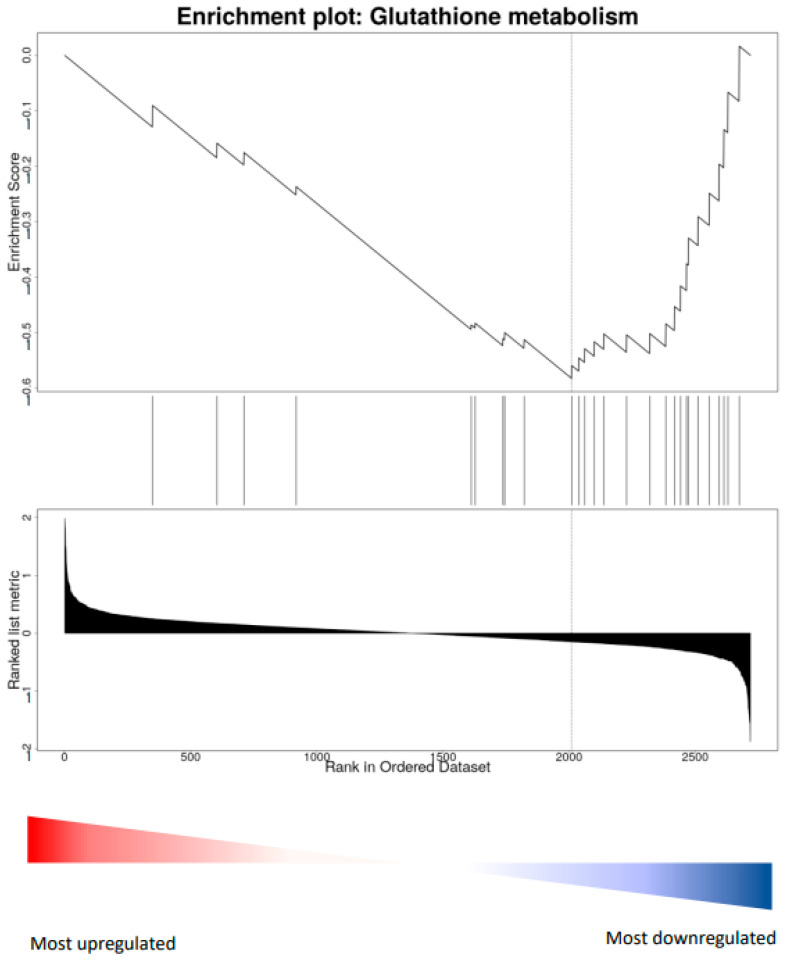
Figure 6.
Example of relevant gene set enrichment analysis. Wheel-running vs. sedentary. Illustrations were generated in WEBGESTALT, all measured proteins were ranked based on fold change. The position in the ranked list of proteins belonging to rno00480 glutathione metabolism is shown as a vertical line. The plot of the enrichment score illustrates the enrichment of these proteins on the right (down-regulated) side of the list.

