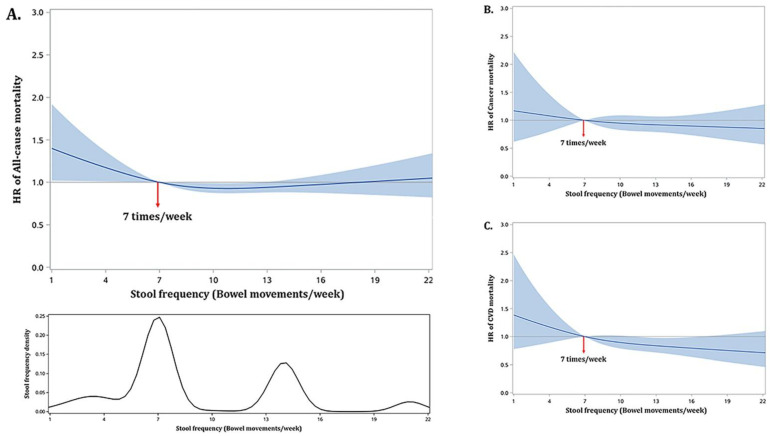
Figure 2.
Non-linear relationship between stool frequency and all-cause (A), cancer- (B), and CVD-specific mortality (C) in U.S. adults (NHANES 2005–2010). The non-linear relationship is depicted by using a restricted cubic spline with 3 knots at stool frequencies of 4, 7 (reference), and 14 times/week of bowel movements. The solid curves represent HRs estimated by using weighted Cox regression models adjusting for age, sex, race/ethnicity, family income, BMI, smoking status, alcohol consumptions, physical activities, dietary fiber intake, and history of chronic diseases. The shaded area represents the 95% confidence intervals of the HRs.

