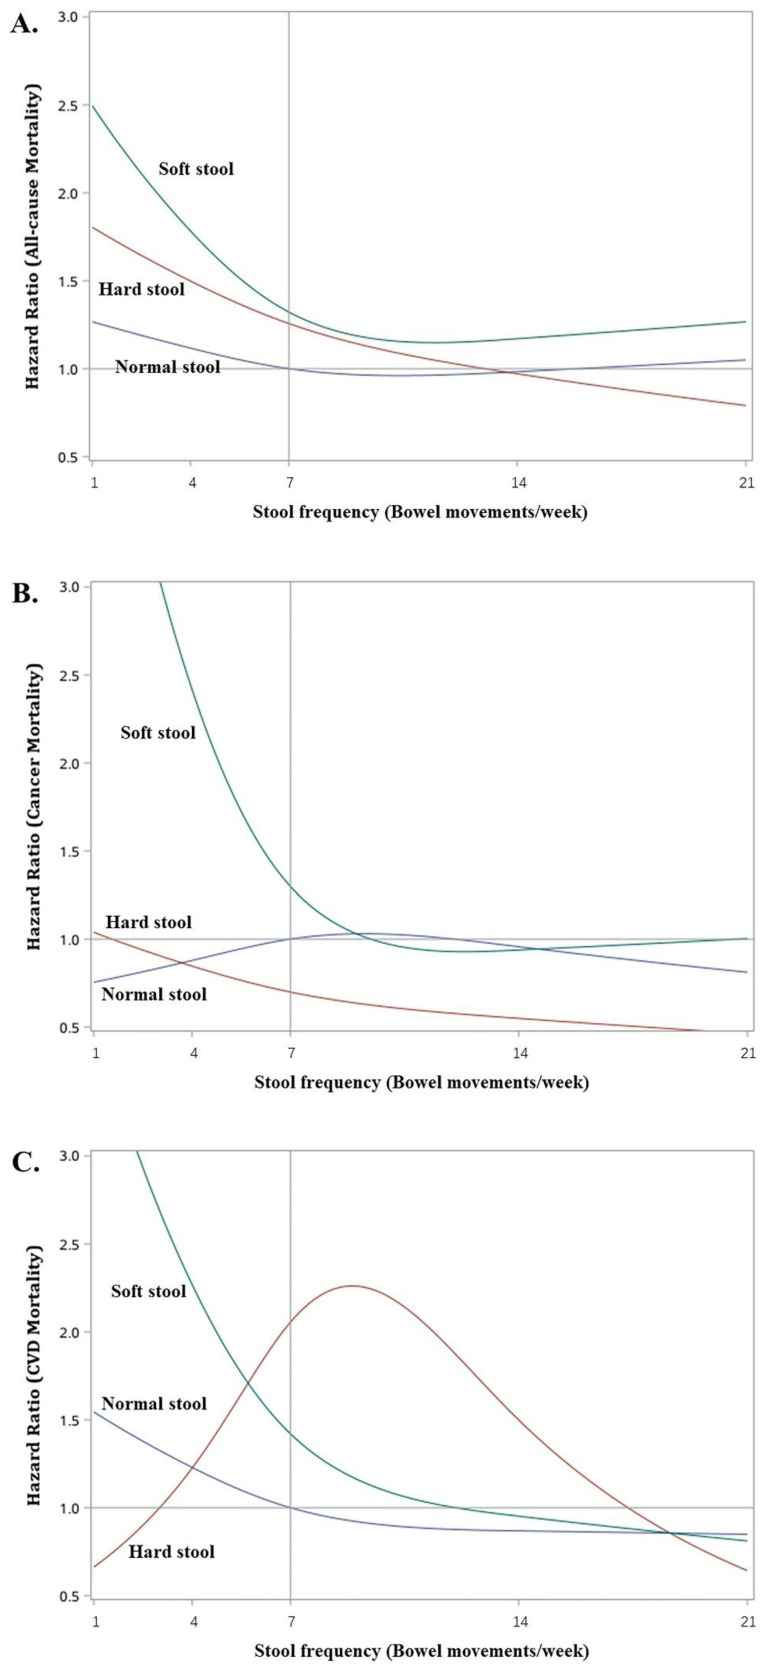
Figure 3.
Non-linear relationship between stool frequency and all-cause mortality (A), cancer mortality (B), and CVD mortality (C) stratified by stool type in U.S. adults (NHANES 2005–2010). The non-linear relationship is depicted by using a restricted cubic spline with 3 knots at stool frequencies of 4, 7, and 14 times/week. The solid curves represent HRs (with respect to normal stool at 7 times/week) estimated by using weighted Cox regression models adjusted for age, sex, race/ethnicity, family income, BMI, smoking status, alcohol consumptions, physical activities, dietary fiber intake, and history of chronic diseases. Normal stool includes type 3 (a sausage shape with cracks in the surface) and type 4 (like a sausage or snake, smooth and soft) stools; Hard stool include type 1 (separate hard lumps, like nuts) and type 2 (like a sausage but lumpy) stools; Soft stool include type 5 (soft blobs with clear-cut edges), type 6 (fluffy pieces with ragged edges, a mushy stool) and type 7 (watery, no solid pieces) stools.

