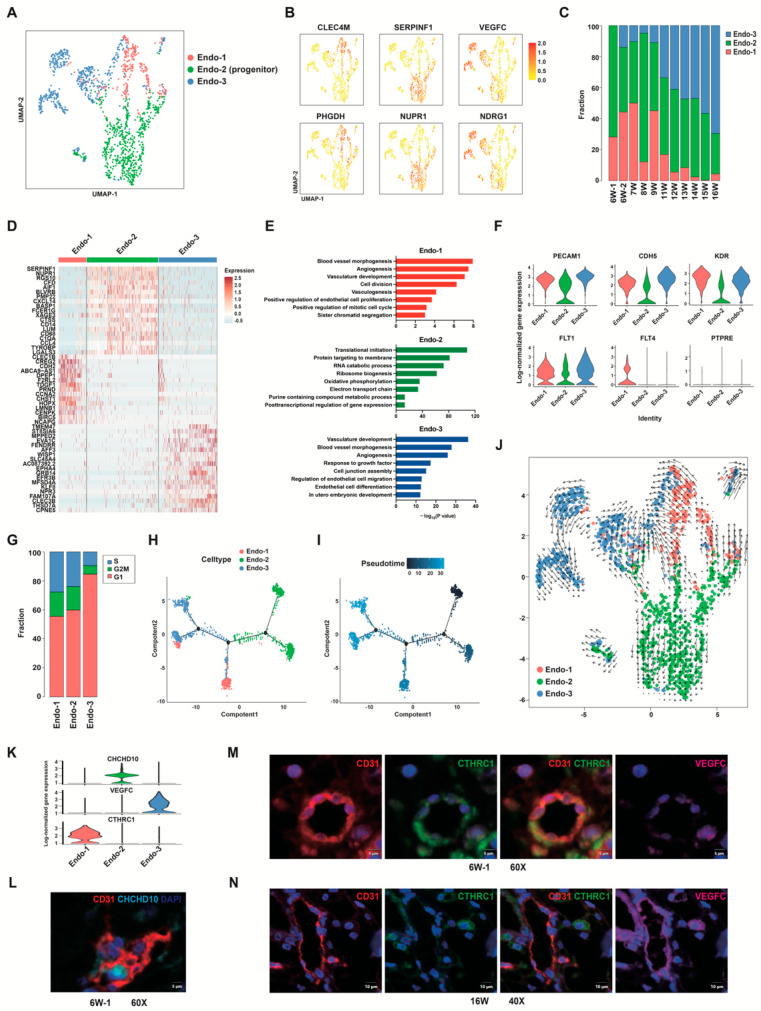
Figure 2.
Single-cell RNA-seq analysis of placental endothelial cells from the first and second trimesters. (A) UMAP plot showing three different subtypes of human placental endothelial cells. (B) UMAP plots of the expression distribution for selected cluster-specific genes. (C) The proportions of three EC clusters at each developmental timepoint. (D) Heatmap of top 20 DEGs in three EC clusters. (E) Representative GO analysis terms of DEGs in Endo-1 (red), Endo-2 (green) and Endo-3 (blue) clusters. (F) Violin plots showing the expression levels of endothelial markers PECAM1 and CDH5, VEGFR coding genes FLT1, FLT4, and KDR, hematopoietic marker PTPRE in each EC clusters. (G) Cell cycle analysis of three EC clusters. (H,I) Pseudotime analysis of placental endothelial cells, cells on the tree are colored by cluster (H) or pseudotime (I). (J) Projection of non-linear RNA velocity fields onto the UMAP space in (A). (K) Violin plot displaying selected cluster-specific genes. (L) Immunofluorescence staining of human first-trimester placental villi using the CD31 and CHCHD10 antibodies. DAPI staining shows the nuclei. Scale bar, 5 μm. (M) Immunofluorescence staining of human first trimester placental villi using CD31, VEGFC, CTHRC1 antibodies. Scale bar, 5 μm. (N) Immunofluorescence staining of human second trimester placental villi using CD31, VEGFC, CTHRC1 antibodies. Scale bar, 10 μm. DEGs, differentially expressed genes.

