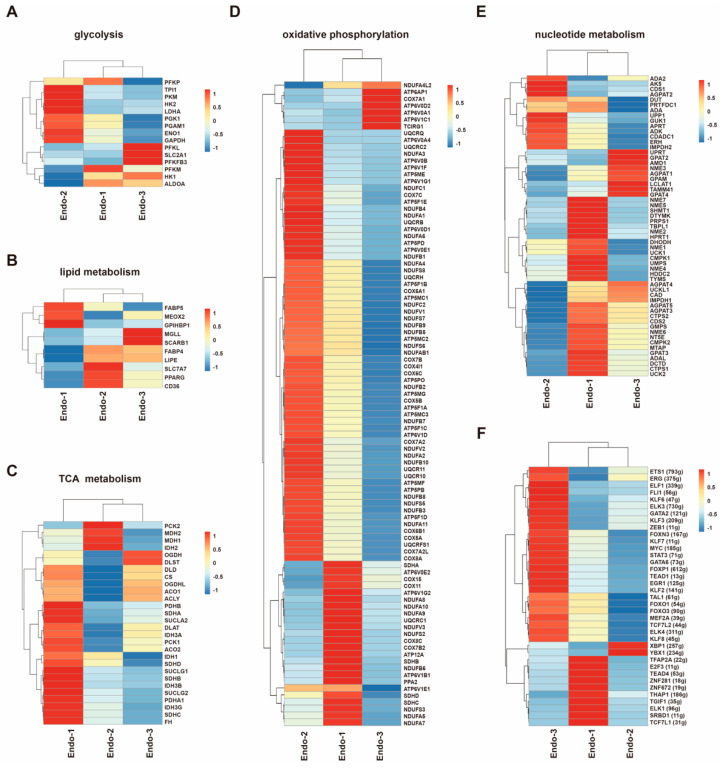
Figure 3.
Metabolic heterogeneity and transcriptional regulatory heterogeneity in placental endothelial cells. (A–E) Heatmaps of representative metabolic genes involved in glycolysis (A), lipid metabolism (B), TCA metabolism (C), oxidative phosphorylation (D), and nucleotide metabolism (E) in three EC clusters. (F) Activity heatmap of the inferred transcription-factor gene-regulatory networks (SCENIC). The t values of AUC scores of expression regulation by transcription factors are estimated using SCENIC, per EC cluster. Color scale: red, high expression; blue, low expression.

