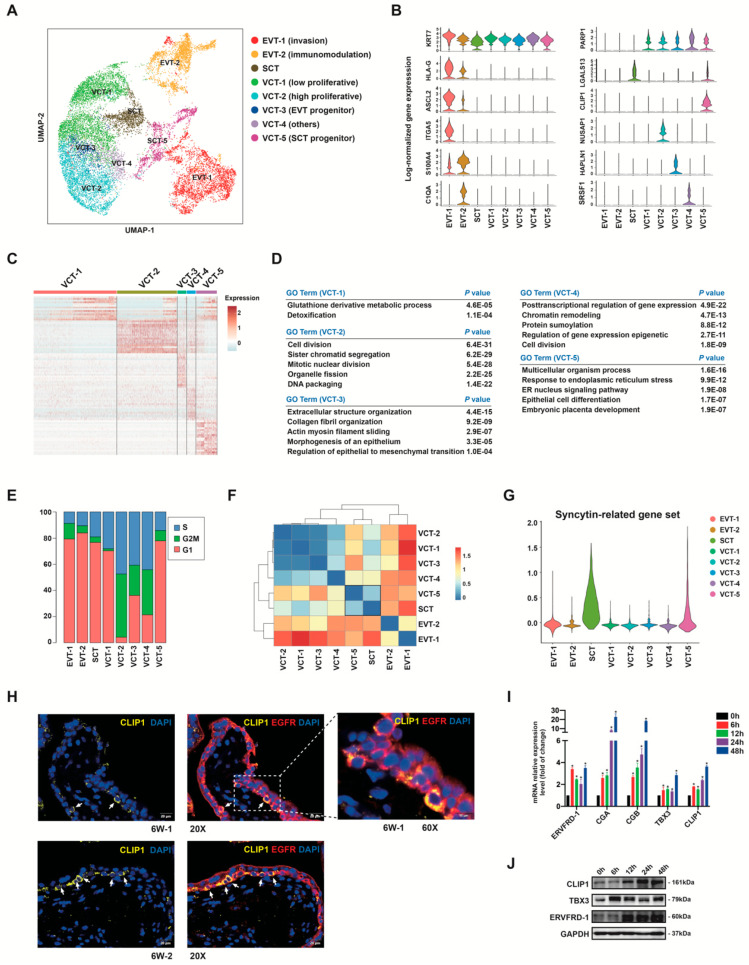
Figure 4.
Cell subtype identification of human placental trophoblast cells. (A) UMAP plot showing eight subtypes of human placental trophoblast cells. (B) Violin plots showing the expression levels of representative marker genes across the eight clusters. Y-axis demonstrates log scale normalized read count. (C,D) Heatmap and GO enriched terms of cell type differentially expressed genes among the five VCT clusters. (E) Cell cycle analysis of eight trophoblast clusters. (F) Heatmap and the clustering structure show the dissimilarity across the trophoblast subpopulations. Blue color denotes the high similarity and red color denotes the low similarity. (G) Violin plots showing the expression levels of a representative syncytin-related gene set (ERVFRD-1, MFSD2A, ERVW-1, ASCT1, ASCT2) for each trophoblast cluster. (H) Immunofluorescence staining for the indicated VCT-5 marker CLIP1 and trophoblast marker EGFR in 6 weeks of gestation placenta. The white arrowheads indicate EGFR+CLIP1+ cells. Scale bars, 20 μm. (I,J) In vitro analysis confirmed CLIP1 is induced under fusion differentiation conditions. BeWo trophoblast cells were exposed to differentiating conditions (50 μM forskolin) for 0, 6, 12, 24, or 48 h. qRT-PCR (I) and Western blotting (J) showed the expression of CLIP1 and SCT marker genes mRNA and protein levels evaluated. * p < 0.05, n = 3.

