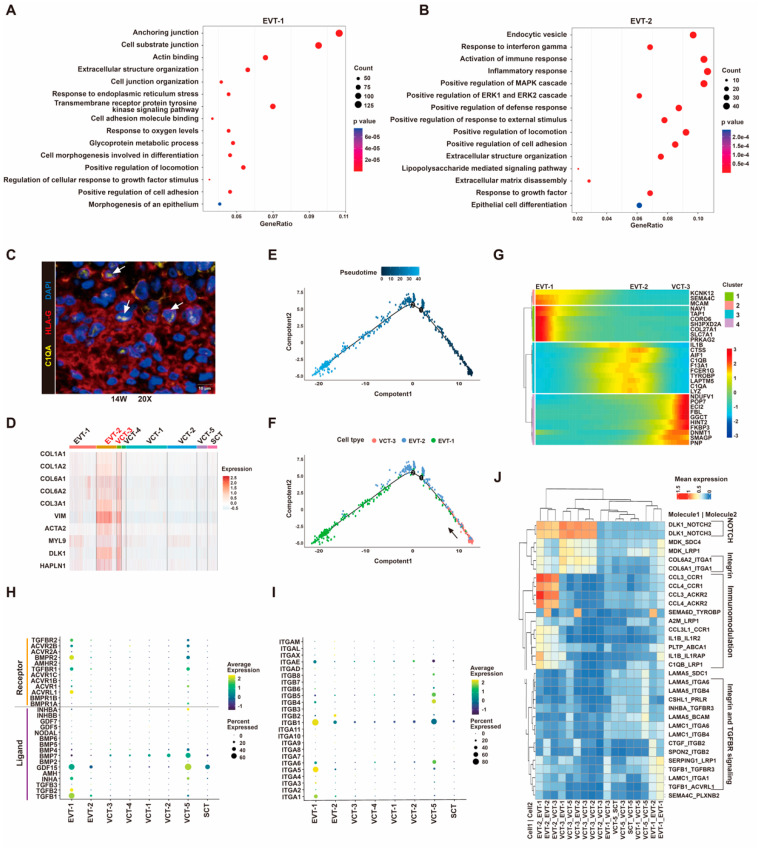
Figure 6.
EVT subtypes and VCT to EVT differentiation analysis. (A,B) GO analysis of differentially expressed genes of EVT1 (A) and EVT2 (B). The size of the circles represents the number of significantly enriched genes in each item. The color key from blue to red indicates low to high average gene expression. (C) Immunofluorescence staining for C1QA and HLA-G in the decidua of 14 gestational weeks human placenta. The white arrowheads indicate C1QA and HLA-G double positive cells. Scale bars, 10 μm. (D) Heatmap showing the relative expression of EMT genes in each trophoblast cluster. (E,F) Pseudotime analysis of VCT-3 and EVTs, cells on the tree are colored by pseudotime (E) and cluster (F). (G) Expression pattern over pseudotime for the top 10 most variable genes were shown on the y-axis. Each column represents one cell. Expression ranged from dark blue (lowest) to red (highest). (H,I) The expression of TGF-β signaling pathway (H) and integrins (I) in trophoblast clusters. The color key from blue to yellow indicates low to high average gene expression, respectively. The dot size indicates the percentage of cells expressing a certain marker. (J) Ligand-receptor interaction analysis within trophoblast clusters. Molecule 1 is expressed by Cell 1 and Molecule 2 is expressed by Cell 2.

