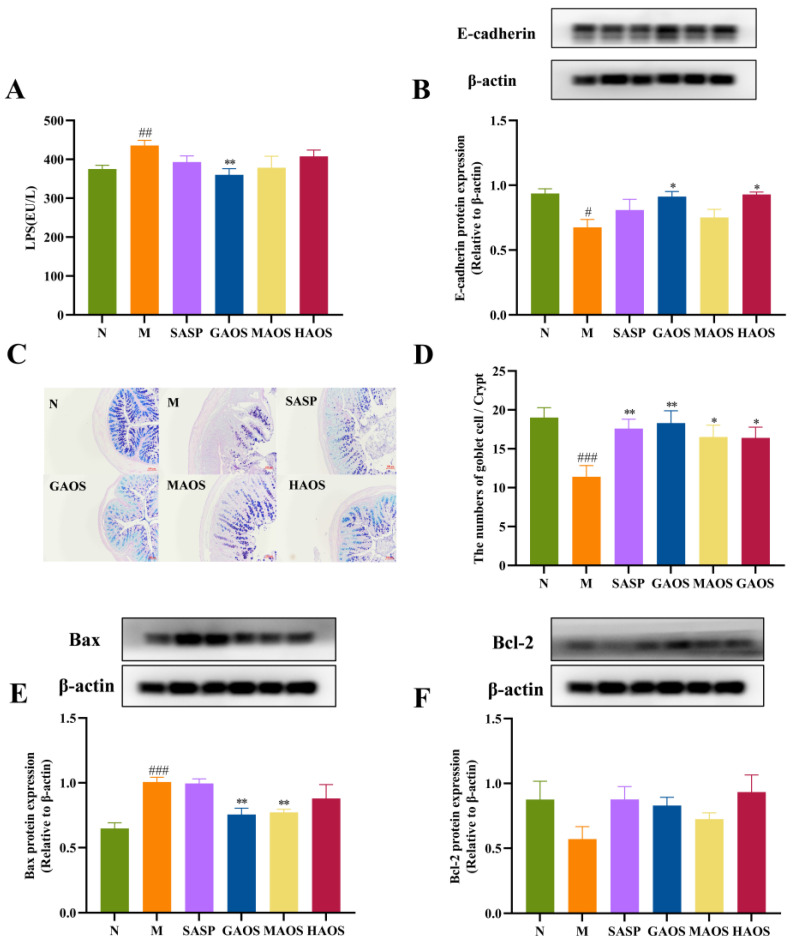
Figure 3.
Effects of alginate oligosaccharides on the intestinal mucosal barrier in DSS-induced colitis mice. (A) The levels of LPS in serum (n = 8). (B) The protein levels of E-cadherin. The relative intensities of E-cadherin (n = 3). (C) Images of AB-PAS-stained sections of the colon (magnification ×400). (D) Goblet cell number per villus (n = 8). (E) The protein levels of Bax (n = 3). (F) The protein levels of Bcl-2 (n = 3). Data were mean ± SEM. # p < 0.05, ## p < 0.01, ### p < 0.001 vs. the N group; * p < 0.05, ** p < 0.01 vs. the M group.

