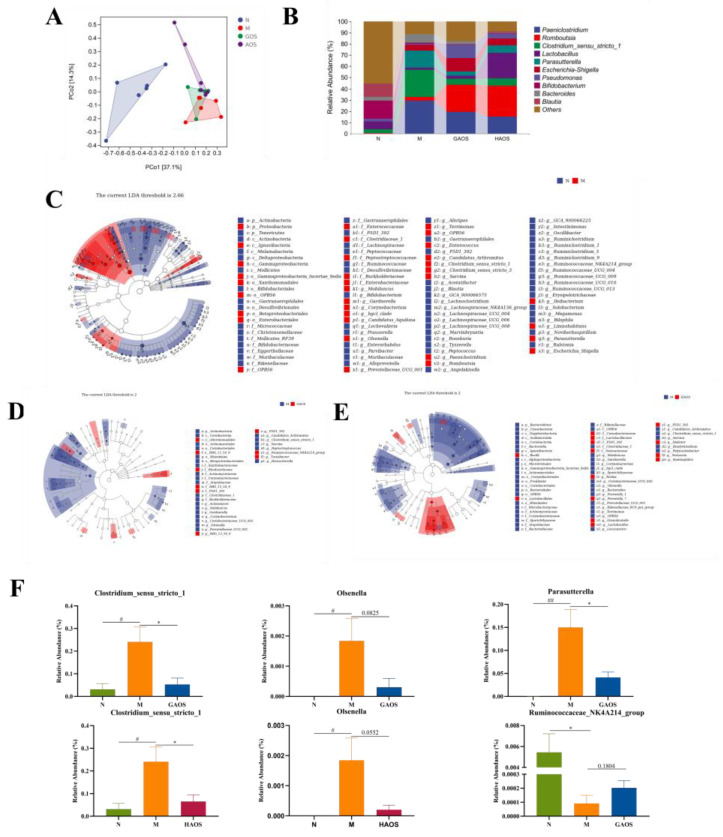
Figure 5.
Effects of alginate oligosaccharides administration on gut microbiota in DSS-induced colitis mice. (A) Principal component analysis (PCA) with the cluster. (B) Microbial distributions of different groups at the genus level. LDA distribution. Linear discriminate analysis effect size (LEfSe) was performed to determine the difference in abundance; the threshold of the LDA score was 2.0. (C) The LEfSe analysis between N and M. (D) The LEfSe analysis between M and GAOS. (E) The LEfSe analysis between M and HAOS. (F) The relative abundance of Clostridiaceae_1, Olsenella, Parasutterella, and Ruminoccaceae_NK4A214_group. Data were mean ± SEM (n = 6). # p < 0.05, ## p < 0.01 vs. the N group; * p < 0.05 vs. the M group.

