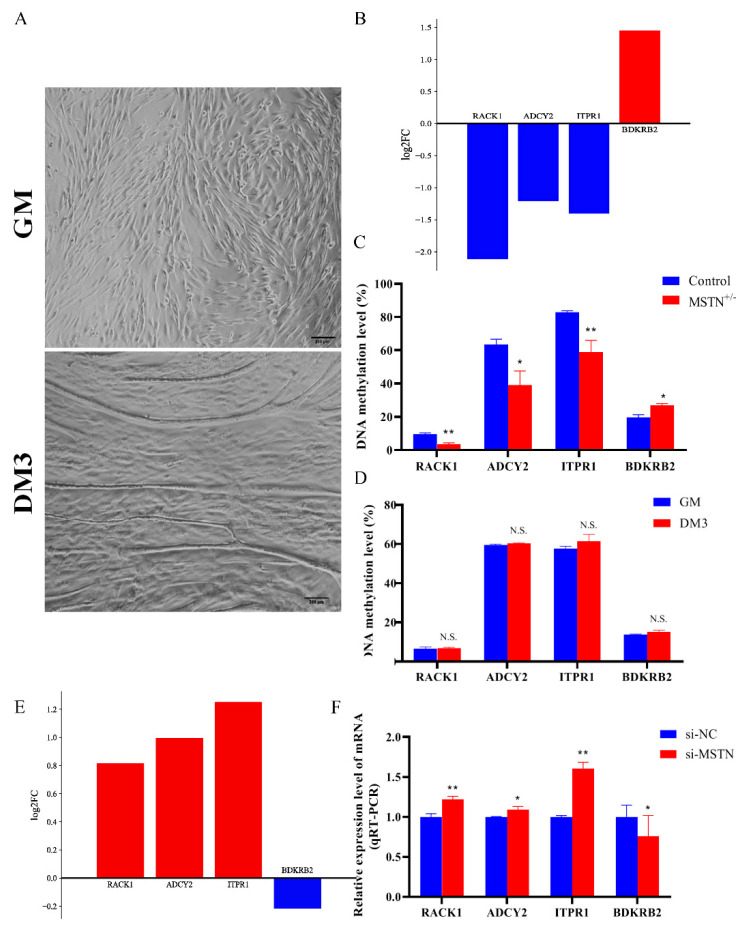
Figure 2.
Accuracy verification of WGBS data. (A) Cell maps of GM and DM3 (100×). (B) Upregulation or downregulation of RACK1, ADCY2, ITPR1, and BDKRB2 in WGBS-seq data. (C) Histogram of DNA methylation levels (pyrosequencing) of muscle samples. (D) Histogram of DNA methylation levels (pyrosequencing) of cell samples. (E) Upregulation or downregulation of RACK1, ADCY2, ITPR1, and BDKRB2 in RNA-seq data. (F) RT-PCR detection of RACK1, ADCY2, ITPR1, and BDKRB2 transcript levels. Differences between groups were statistically analyzed using Student’s t-test. p < 0.05 was considered statistically significant (* p < 0.05 and ** p < 0.01). And N.S., not significant (p > 0.05).

