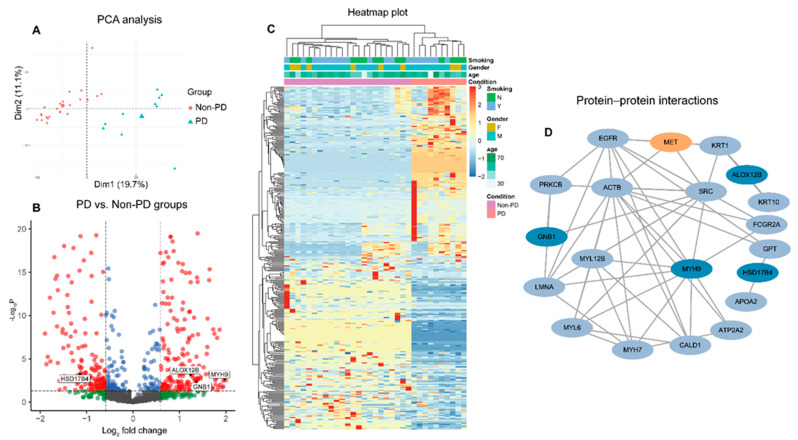
Figure 2.
Plasma-based proteomics landscape and biomarkers selection at baseline. (A) Principal component analysis of 33 patients; the bigger points in the PD and non-PD groups represent the median value of each group. A volcano plot (B) and heatmap plot (C) of differentially expressed proteins between PD and non-PD groups; the red points in the volcano plot indicate the proteins that foldchange >1.5 and p value < 0.5; the green points indicate the proteins that foldchange >1.5 and p value ≥ 0.5; the blue points indicate the proteins that foldchange ≤1.5 and p value < 0.5; the grey points indicate the proteins that foldchange ≤ 1.5 and p value ≥ 0.5. (D) Protein-protein interaction network of differentially expressed proteins.

