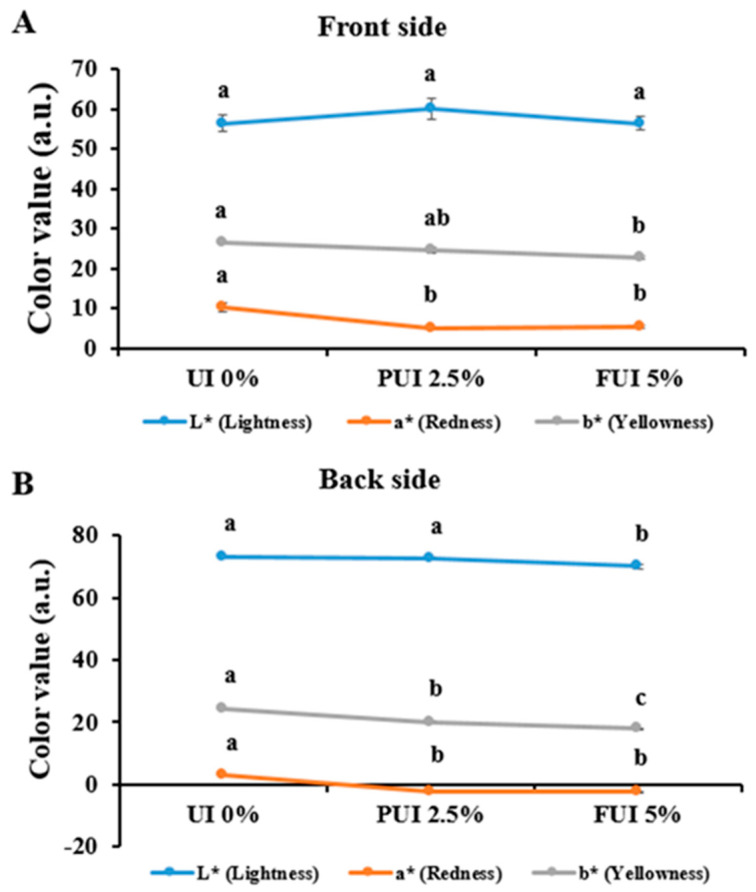
Figure 3.
Changes in color values in both (A) front side and (B) back side of cookies prepared with UI 0%, PUI 2.5%, and FUI 5% UI. The dimension L* means lightness, with 100 for white and 0 for black appearance; a* indicates redness for positive value and greenness for negative value, b* indicates yellowness for positive value and blueness for a negative value. Data represent the mean ± SE of 3 observations, where groups not sharing a letter are expressed as significantly different (p < 0.05).

