. 2023 Jan 6;131(1):017003. doi: 10.1289/EHP10745

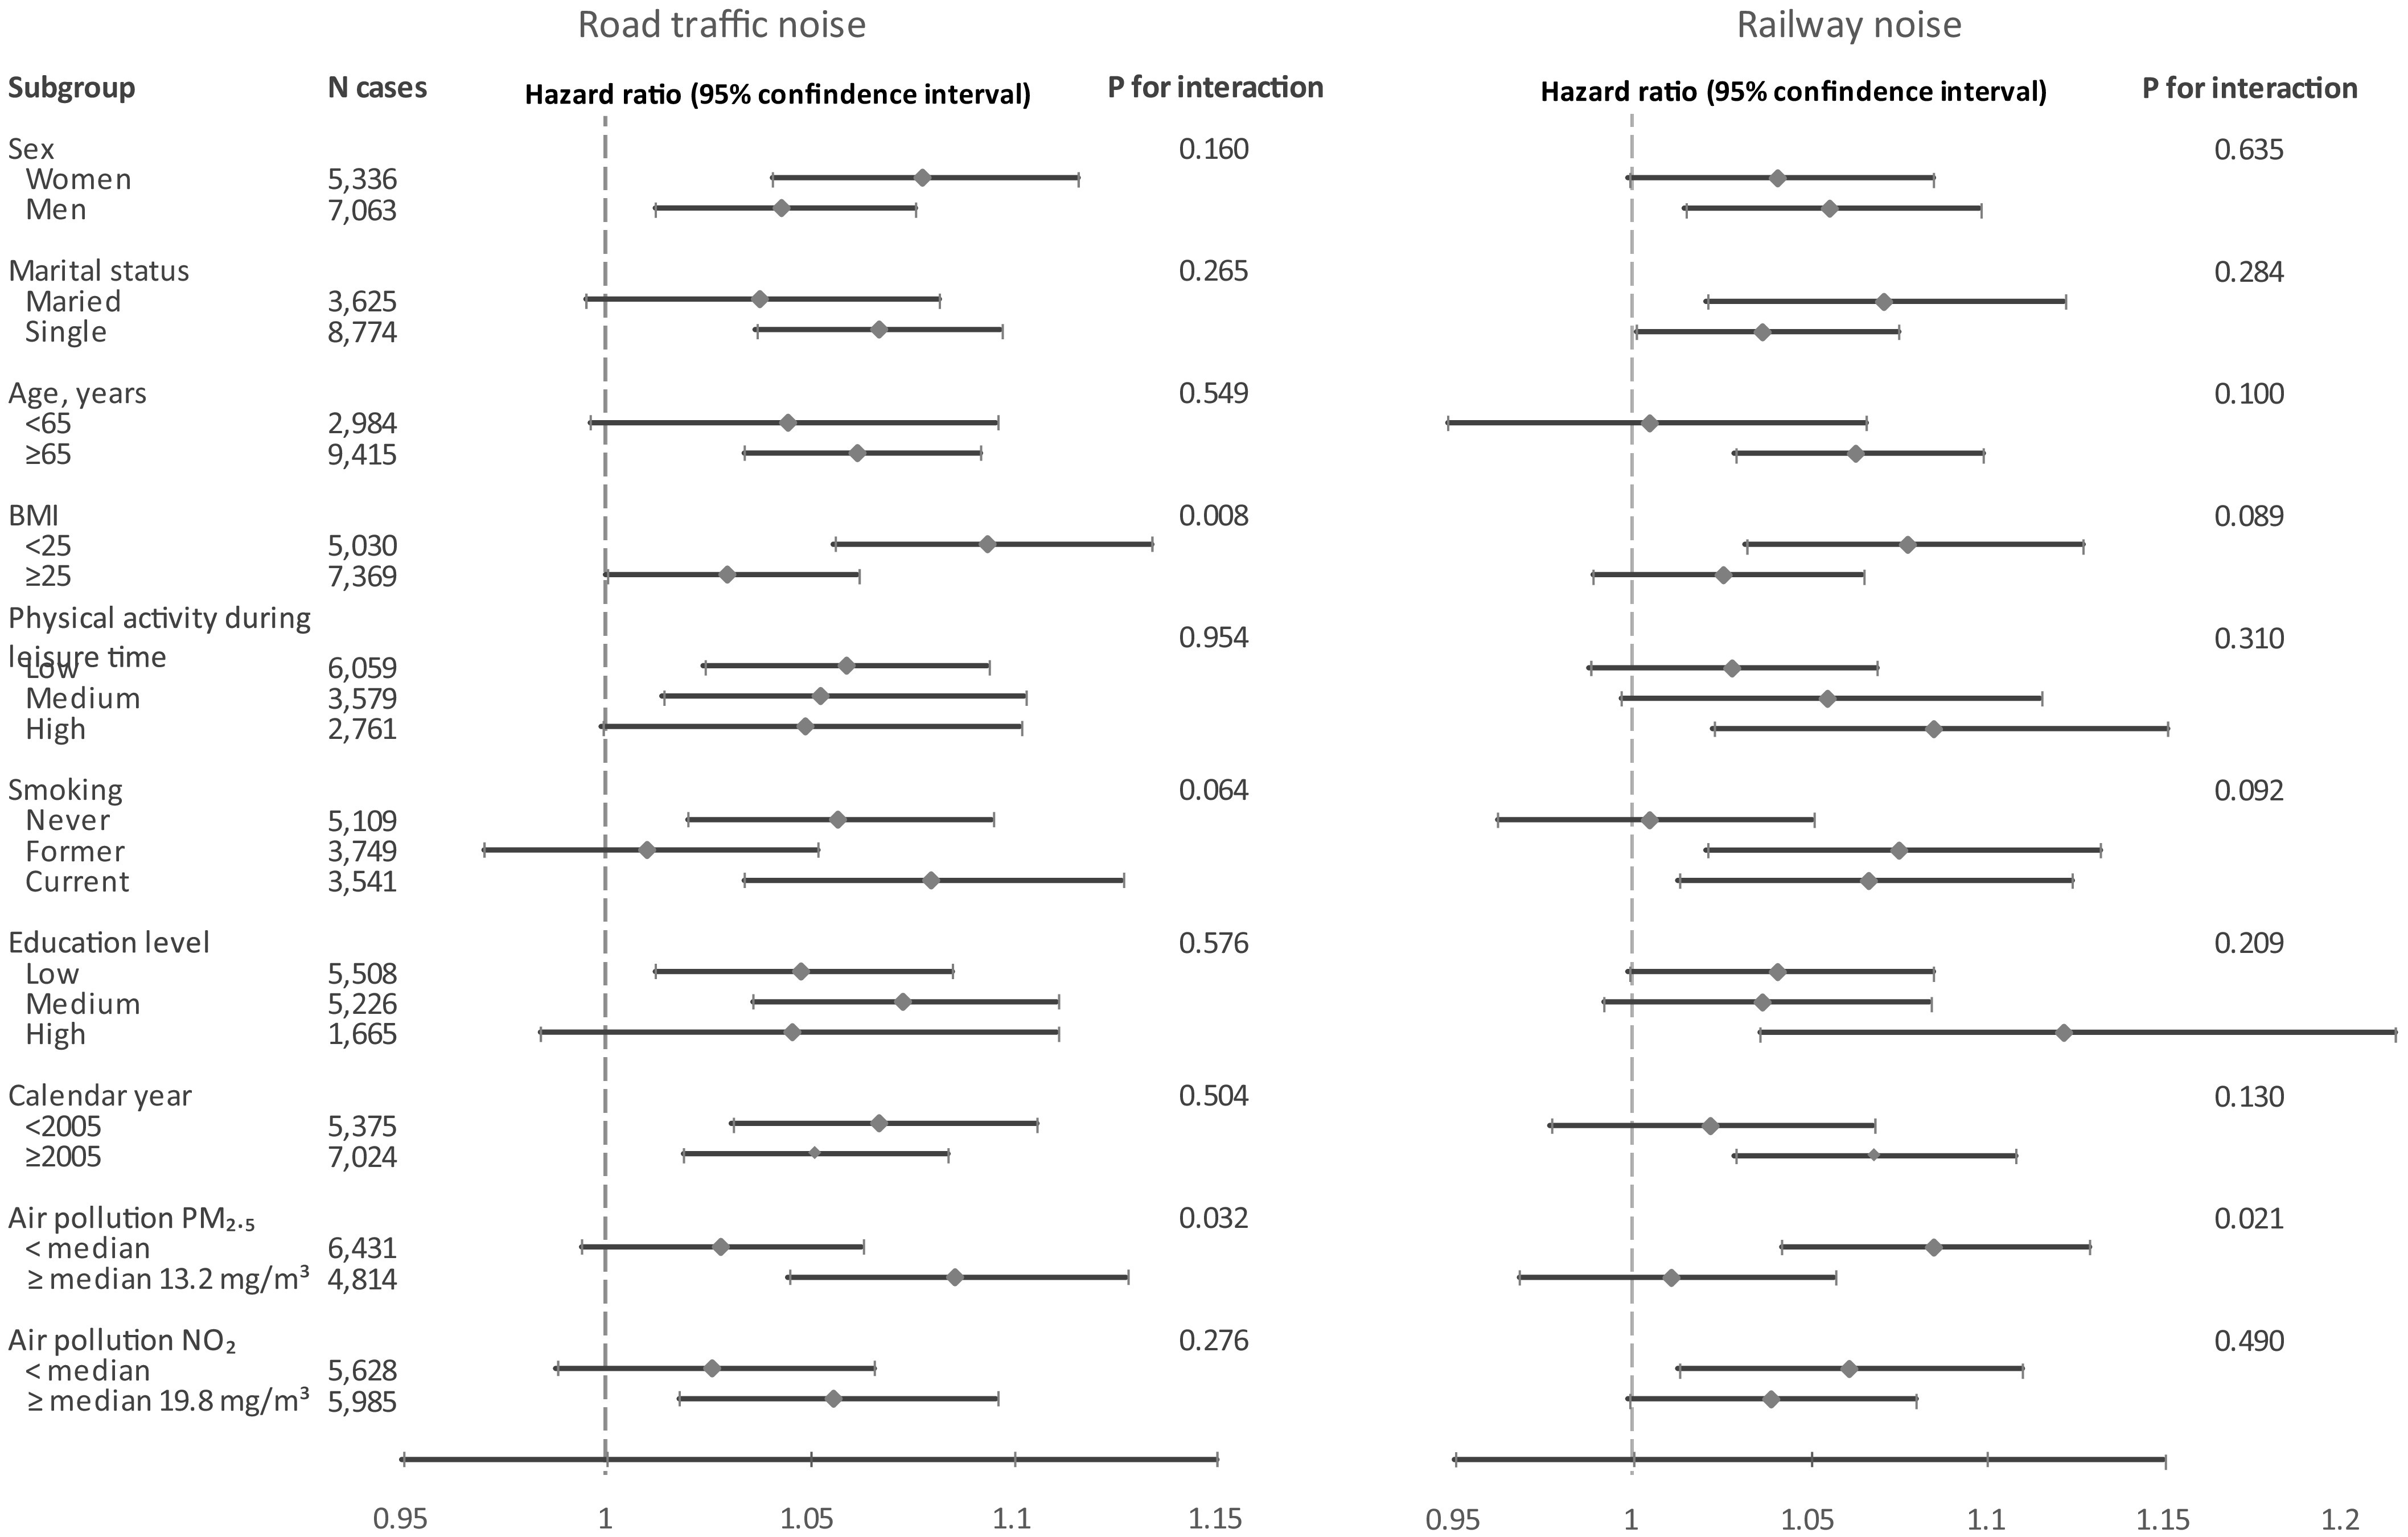
Figure 2.

Figure 2 is a set of two forest plots titled Road traffic noise and Railway noise, plotting subgroups with number of cases (bottom to top), air pollution nitrogen dioxide, including greater than or equal to median 19.8 milligrams per meter cubed with 5985 cases and less than median with 5628 cases; Air pollution particulate matter begin subscript 2.5 end subscript, including greater than or equal to median 13.2 milligrams per meter cubed with 5985 cases and less than median with 4814 cases and less than median with 6431 cases; Calendar year, including greater than or equal to 2005 with 7024 cases and less than 2005 with 5375 cases; Education level, including high with 1665 cases, medium with 5226 cases, and low with 5508 cases; Smoking, including current with 3541 cases, Former with 3749 cases, and never with 5109 cases; Physical activity during leisure time, including high with 2761 cases, medium with 3579 cases, and low with 6059 cases; Body mass index, including greater than or equal to 25 with 7369 cases and less than 25 with 5030 cases; Age, years, including greater than or equal to 9415 cases and less than 65 with 2984 cases; marital status, including single with 8774 and married with 3625 cases; and sex, including men with 7063 cases and women with 5336 cases (y-axis) across transportation noise and each potential modifier, ranging from 0.95 to 1.15 in increments of 0.05 and 0.95 to 1.2 in increments of 0.05 (x-axis) for hazard ratio (95 percent confidence intervals) and uppercase p of interaction, respectively.

HR and 95% CI for ischemic heart disease excluding angina pectoris in relation to exposure to noise from road traffic (left) and railways (right) per 10 dB Lden during 5 y prior to the event according to covariates and air pollution exposure. p-Values are Wald pInteraction terms. Results are presented according to strata of potential effect modifiers based on separate models with interaction terms between transportation noise and each potential modifier, adjusted for age (by design), cohort (strata), sex (men/women), calendar year (in 5 y periods), educational level (low/medium/high), marital status (single/married), area-income (quartiles), and other noise sources indicator (yes/no: road, railway, and aircraft noise; for the three cohorts without aircraft noise information, all cohort members were assigned as no exposure). Note: Corresponding numeric data is available in the Supplementary Excel file “Numeric data for Figures EHP10745.” BMI, body mass index; CI, confidence interval; HR, hazard ratio; IHD, ischemic heart disease; Lden, day-evening-night noise level based on energy equivalent noise level over a whole day with a penalty of 10 dB(A) for nighttime noise (23.00–7.00) and a penalty of 5 dB(A) for evening noise (i.e. 19.00–23.00); NO2, nitrogen dioxide; PM2.5, particulate matter with an aerodynamic diameter of 2.5μm (fine particulate matter).