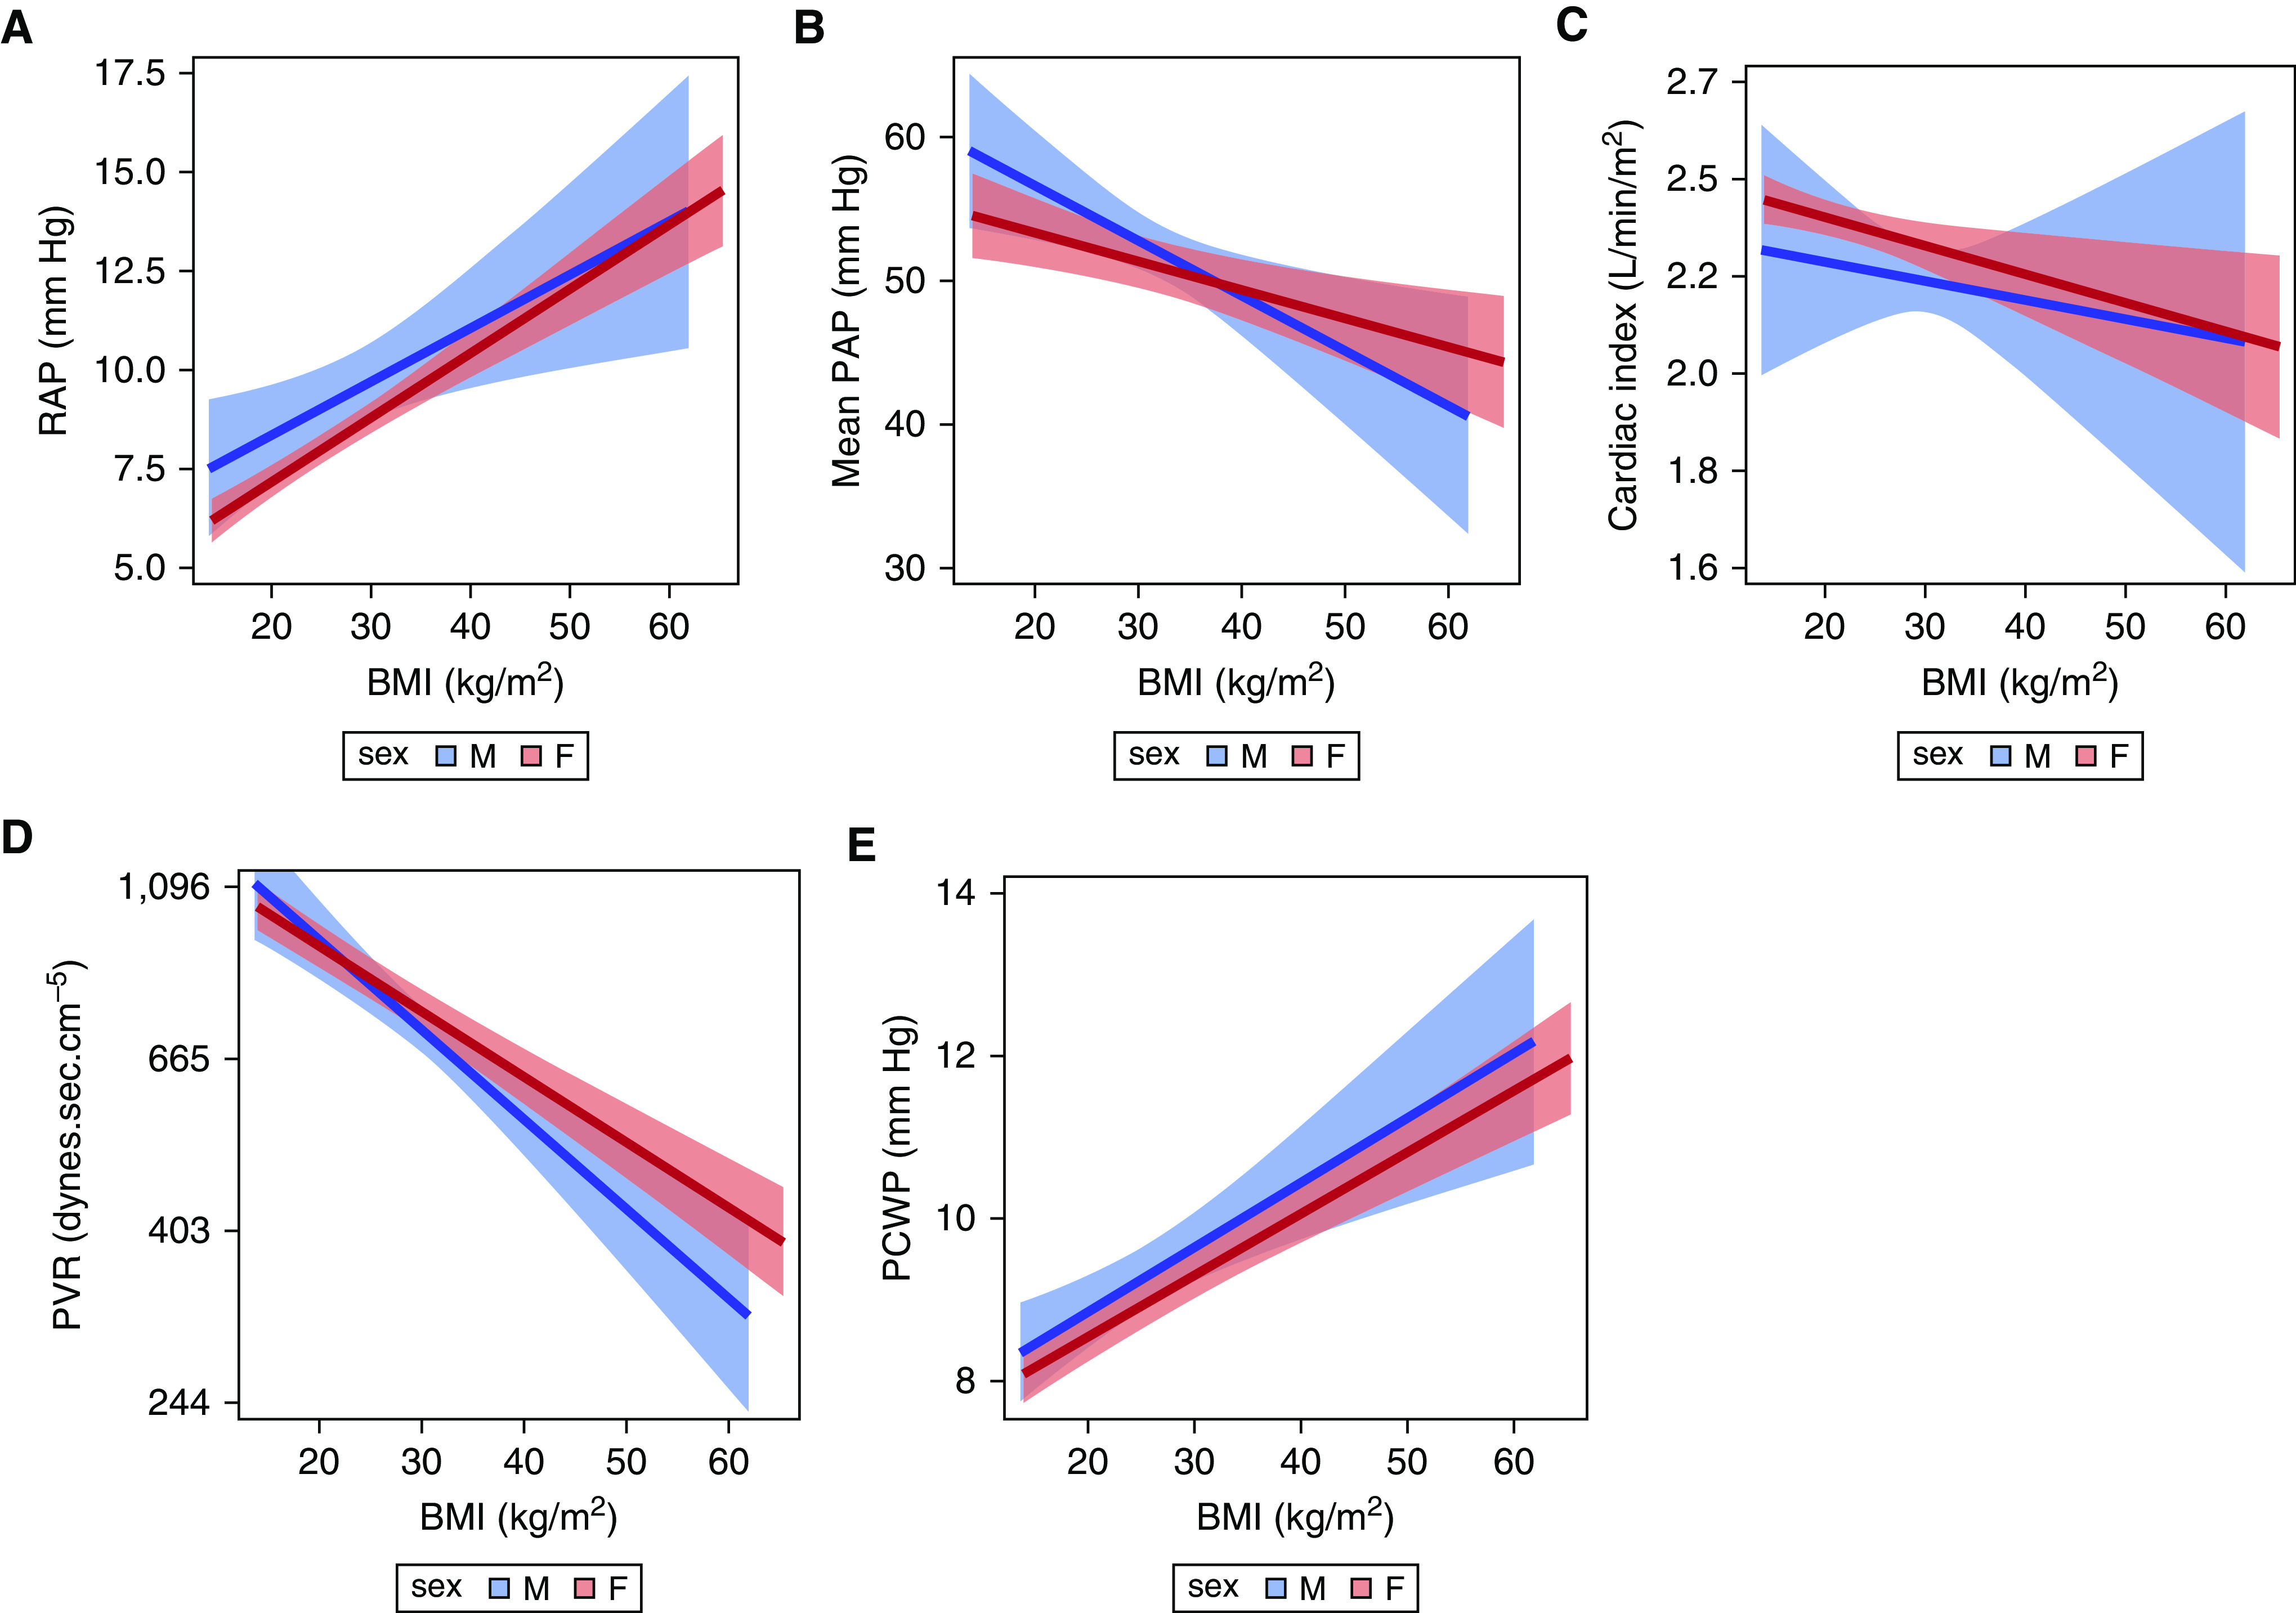
Figure 4.

Associations between BMI and (A) RAP, (B) mean PAP, (C) cardiac index (y-axis values are back-transformed but remain in ln scale), (D) PVR (y-axis values are back-transformed but remain in ln scale), and (E ) PCWP. Red = females; blue = males. The solid line is the effect estimate; lighter bands are the 95% confidence band. BMI = body mass index; PAP = pulmonary artery pressure; PCWP = pulmonary capillary wedge pressure; PVR = pulmonary vascular resistance; RAP = right atrial pressure.
