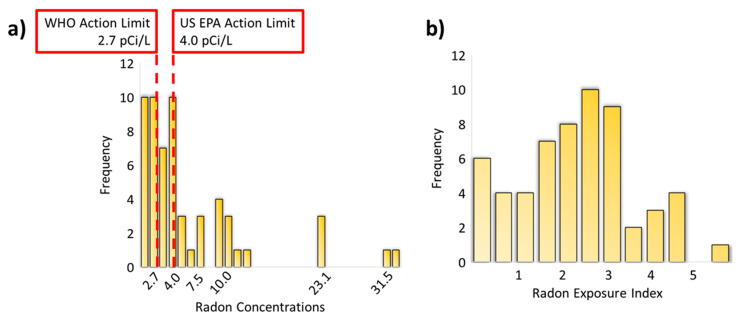
Figure 2.
Histogram of acquired home radon concentrations (a) and of the computed radon exposure index (b). The left histogram is marked with the WHO and the US EPA action limits for indoor radon concentrations (at or above 2.7 and 4.0 pCi/L, respectively). The radon exposure index, calculated at the natural log of home radon concentrations multiplied by the amount of time the person has lived in their home (+1), is relatively normally distributed.

