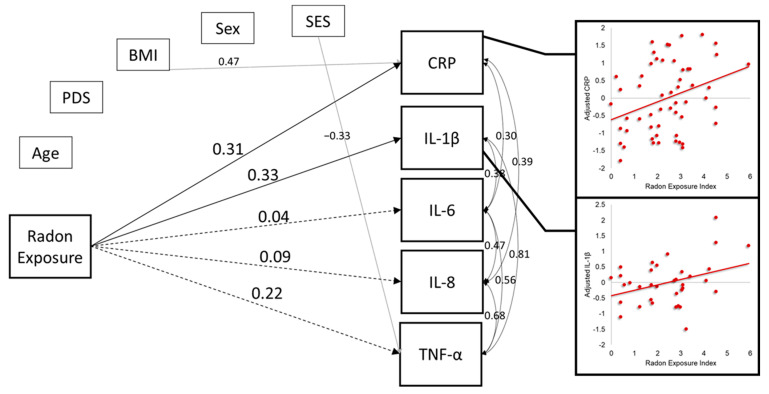
Figure 3.
Model results. For simplicity, only associations of interest between radon exposure and inflammatory markers (regardless of statistical significance), and other effects significant at the pFDR < 0.05 level are shown. All inflammatory markers were natural log transformed. All parameters reported in the figure are standardized coefficients. Solid lines indicate statistically significant associations at the pFDR < 0.05 level, and dashed lines show non-statistically significant associations (pFDR > 0.05). Scatterplots show the statistically significant associations between the radon exposure index and natural log transformed CRP (top), and IL-1β (bottom) after adjusting for the effects of age, sex, pubertal development, BMI, and SES. Sex was dummy coded as 0 = “male”, 1 = “female”. “BMI” = body mass index; “CRP” = c-reactive protein; “IL” = interleukin; “PDS” = pubertal development stage; “SES” = socioeconomic status; “TNF-α” = tumor necrosis factor alpha. Scatterplots of significant associations between radon exposure and inflammatory markers.

