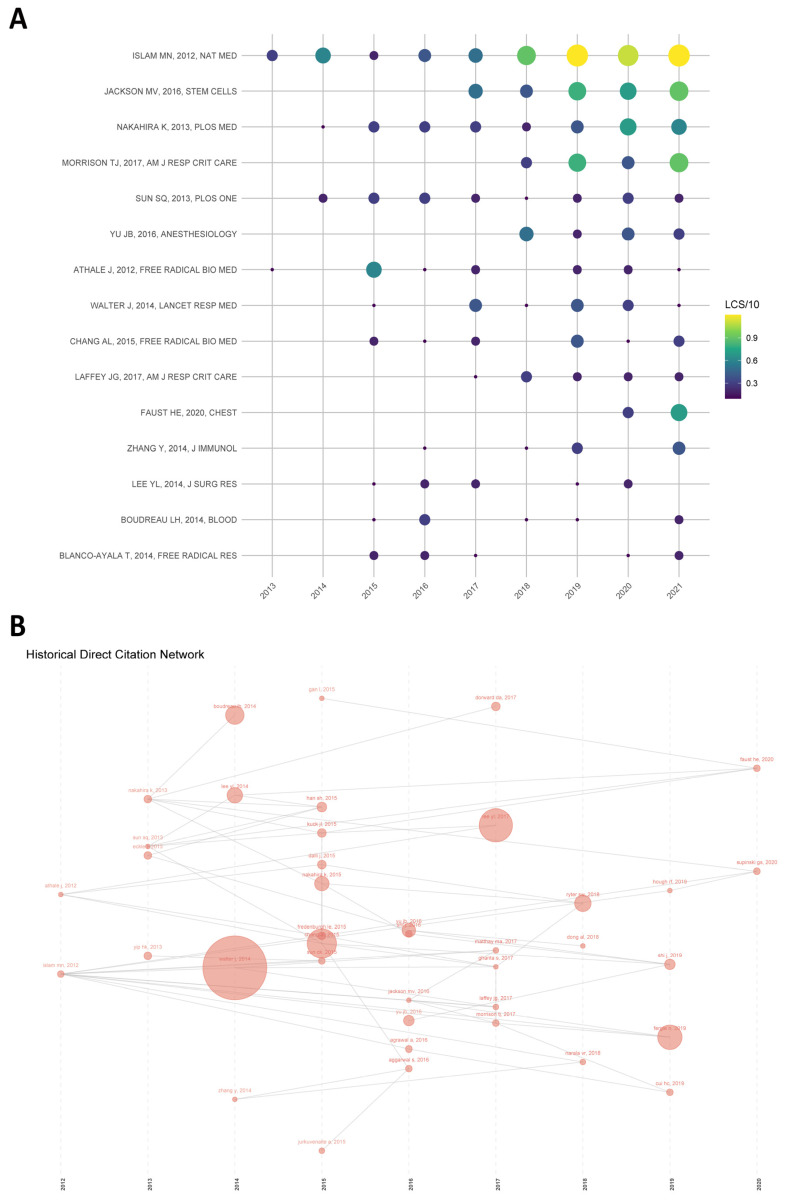
Figure 5.
(A) The yearly number of local citations of papers with high local citation scores (LCS). Note: The size and colors of the circle represent the LCS of papers in that year. The larger the size and the more yellow the color of the circle, the higher the LCS is. (B) One paper cited by the other papers with the top 40 LCS. Note: Each node in the figure signifies a key article, and the directional arrow specifies the citation association between the two articles. The size of each node is proportional to the frequency of this article by the other 39 articles.

