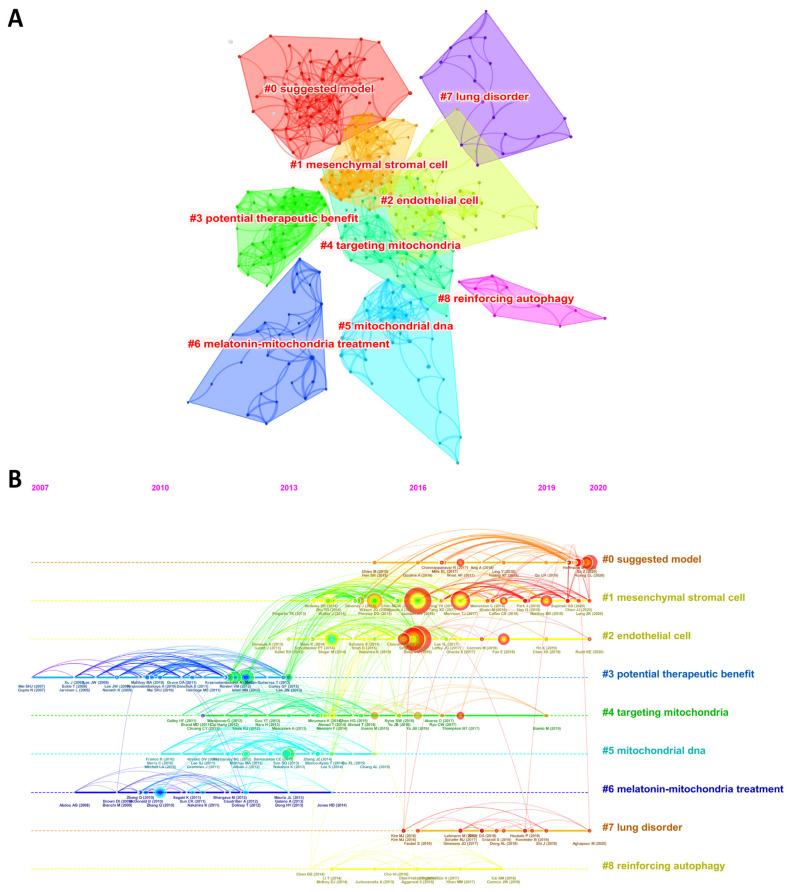
Figure 7.
(A) The clustered network map of co-cited references related to mitochondria in ALI. Note: Each node represents a reference, and different colors represent different clusters. (B) The timeline view of co-citation clusters with their cluster-labels on the right. Note: Each node represents a reference, the size of the circle represents the citation frequency, and the red color of the circles and the connecting curves represents the latest year.

