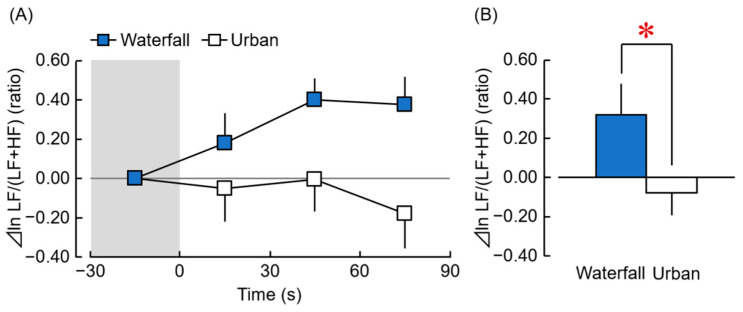
Figure 4.
Changes in the ratio of ln LF/(LF + HF) of HRV exposure to the waterfall vs. urban images. (A) Changes in the 30 s average ln LF/(LF + HF) over 90 s of exposure (difference from the mean value for 30-s pre-stimulation). (B) Changes in the ln LF/(LF + HF) during exposure to the waterfall vs. urban images for 90 s. (n = 27 mean ± standard error). * p < 0.05, paired t-test.

