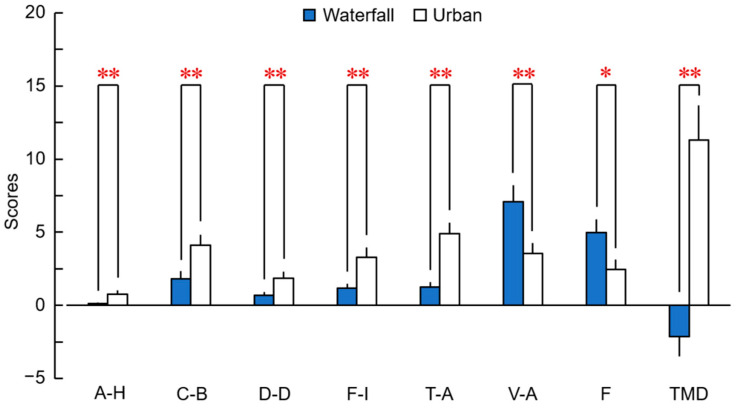
Figure 6.
Psychological effects evaluated by POMS 2 after viewing the waterfall and urban images; n = 27, mean ± standard error, ** p < 0.01, * p < 0.05 (waterfall vs. urban), Wilcoxon signed-rank test. A–H, anger–hostility; C–B, confusion–bewilderment; D–D, depression–dejection; F–I, fatigue–inertia; T–A, tension–anxiety; V–A, vigor–activity; F, friendliness; TMD, total mood disturbance.

