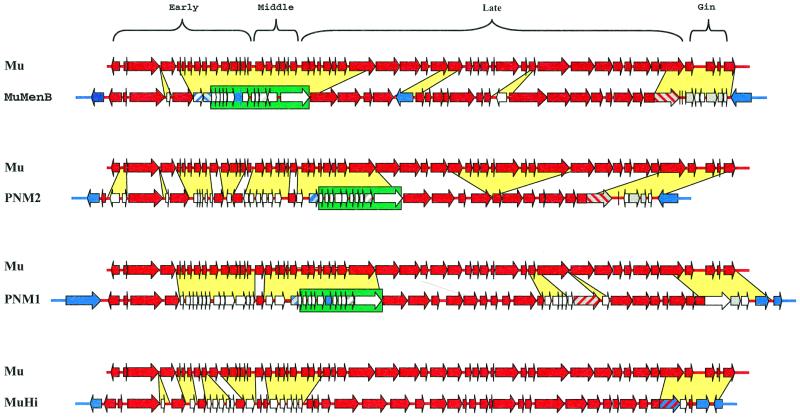
FIG. 2.
Pairwise comparison between the structure of Mu (36,717 bp) and the indicated related Mu-like bacteriophages MuMenB (34,538 bp), PNM1 (39,237 bp), PNM2 (29,321 bp), and MuHi (34,339 bp). Green boxes highlight a group of ORFs specifically acquired by neisserial prophages, whereas yellow spaces indicate genes, which either have been inserted or differ from the corresponding region of Mu. Color codes are as described in the legend to Fig. 1 and on Fig. 1 itself.

