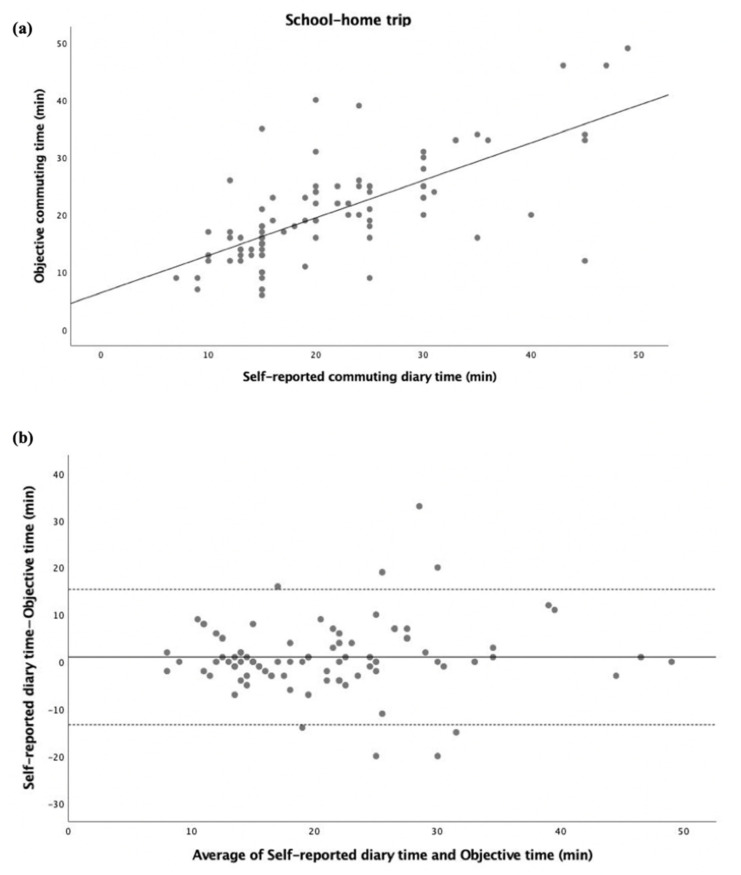
Figure 5.
Commuting time expressed as minutes (school–home trip). (a) Regression of the objective commuting time (y) vs. (x) the self-reported commuting diary time. The regression equation is y = 6.42 + 0.65x. (b) Bland–Altman plot of the commuting time of the school–home trip between self-reported diary time and objective time (y) vs. average of self-reported diary time and objective time (x). The central dotted line represents the mean of differences between the objective time measure and the self-reported time measure; the upper and lower dotted lines represent the upper and lower 95% limits of agreement (mean differences + 1.96 standard deviations of the differences), respectively.

