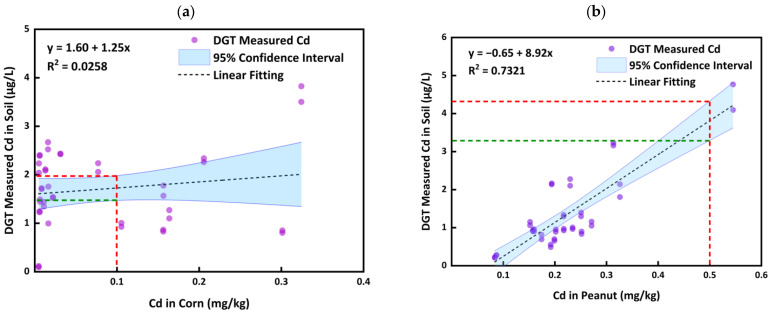
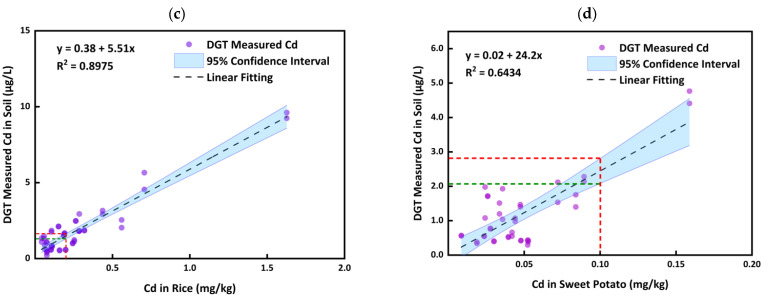
Figure 3.
Relationship between DGT measured Cd concentrations and Cd concentrations in the corn, peanut, sweet potato, and rice (The red dashed vertical lines in the figures represent the limit standards for the agricultural products, and the green and red dashed horizontal lines represent the safe and unsafe concentrations predicted by DGT measurement, respectively).


