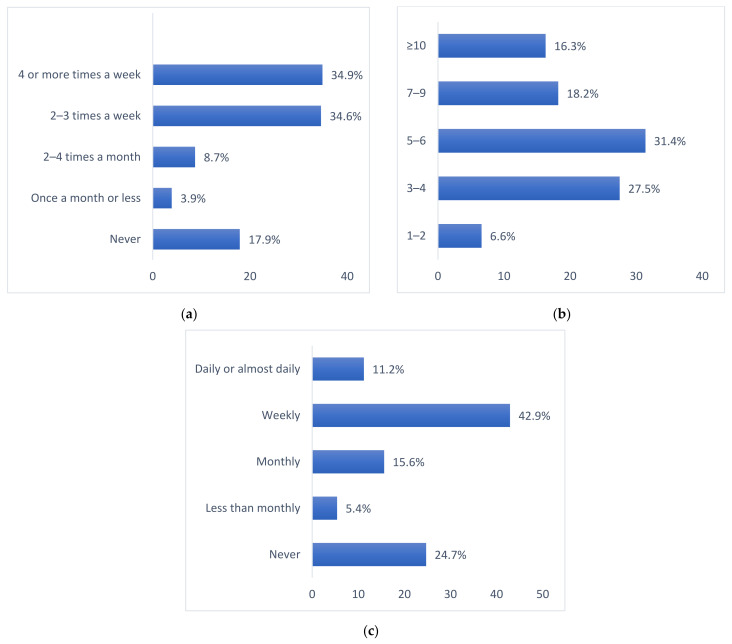
Figure 1.
AUDIT C. Proportions are weighted: (a) Distributions of reported frequency of drinking alcohol among all participants (n = 470); (b) Distributions of reported number of drinks on a typical day when drinking among participants reporting drinking the previous year (n = 405); (c) Distributions of reported frequency of “binge drinking” (drinking ≥ 6 units of alcohol on one occasion) among participants reporting drinking the previous year (n = 405).

