
Fig. 4.
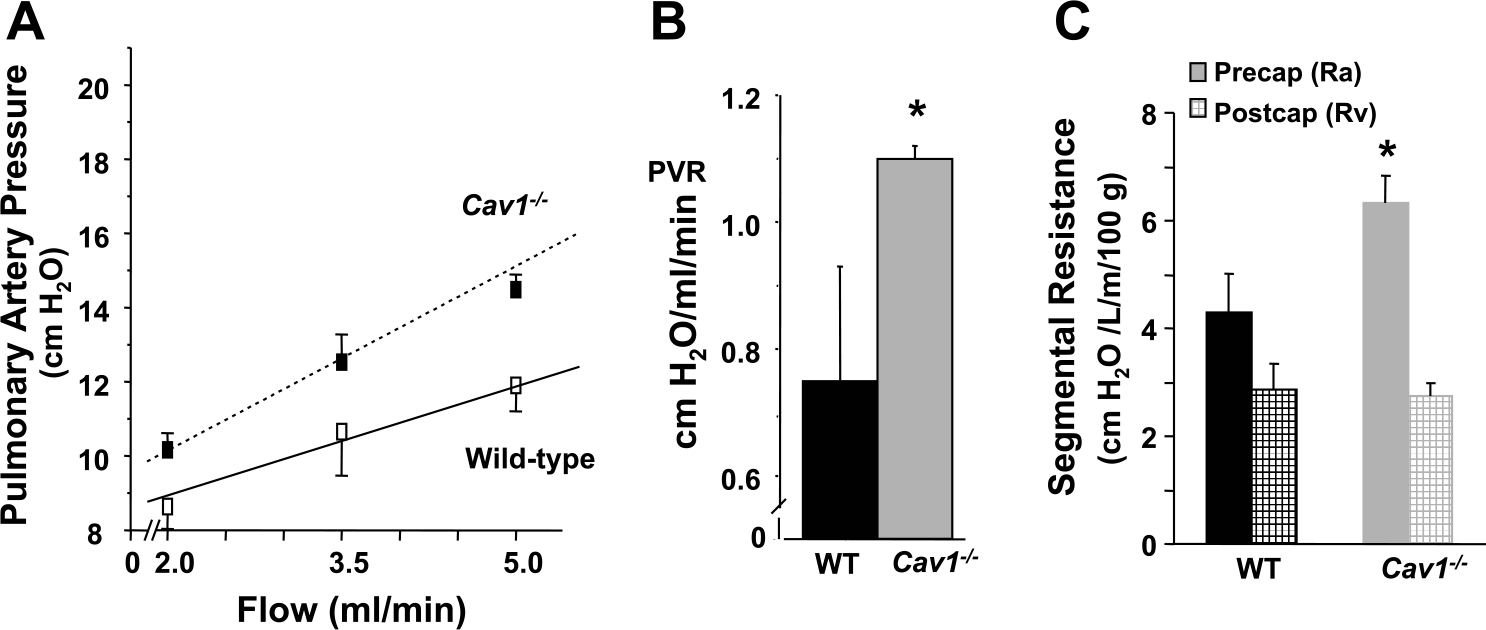
Increased pulmonary vascular resistance (PVR) in Cav1−/− mice. A and B: isolated mouse lung preparations were perfused with HEPES-buffered RPMI using a peristaltic pump. Pulmonary artery pressure was recorded at increasing flows in the range of 2–5 ml/min. The slope of the pressure-flow curve yielded PVR. Lungs from Cav1−/−animals showed an average increase of 46% in PVR compared with WT (0.75 ± 0.2 cmH2O·ml−1·min−1 vs. 1.1 ± 0.02 cmH2O·ml−1·min−1; *P < 0.05 vs. WT; n = 3). C: the increased total PVR in Cav1−/− lungs was localized to the precapillary-capillary segment of the pulmonary vasculature with the aid of the capillary pressure determination. Lungs were perfused at 2 ml/min, and the capillary pressure was measured during a 5-s occlusion of the in- and outflow catheters. Precapillary-capillary (artery resistance, Ra) and postcapillary fractions (vein resistance, Rv) of the PVR were then calculated as described in METHODS. The precapillary resistance was greater in Cav1−/− mouse lungs than in WT (69% vs. 60% of total), and the postcapillary resistance was lower in Cav1−/− mouse lungs than in WT (31% vs. 40% of total).