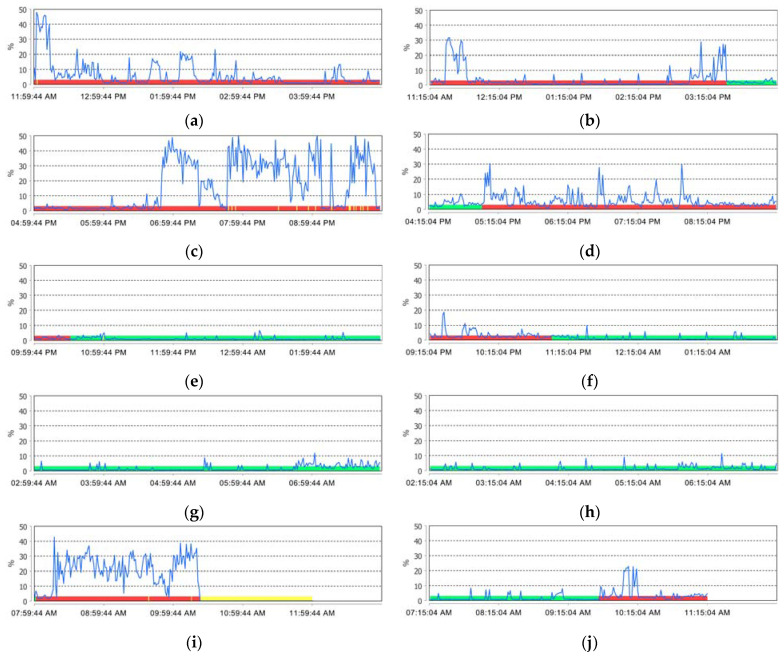
Figure 2.
Comparative analysis of the summary of relevant activities recorded at the masseter level (sleep time interval—green color, awake time interval—red color, detachment time interval—yellow color) for: (a,c,e,g,i) one participant from the study group and (b,d,f,h,j) one participant from the control group.

