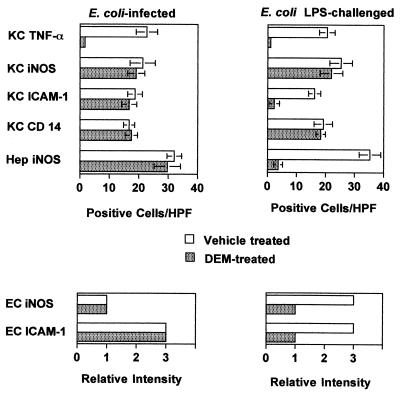
FIG. 4.
Comparison of the effects of glutathione depletion on hepatic inflammatory responses to E. coli bacteria and LPS. C3HeB/FeJ mice (six per group) were treated with vehicle or DEM and then challenged i.p. with either 5 × 10⁷ CFU of E. coli bacteria or 100 μg of E. coli LPS. Liver tissues were recovered either 1.5 h (for TNF-α) or 6 h (for iNOS, CD14 or ICAM-1) later. Kupffer cell (KC) and hepatocyte (Hep) responses are expressed as positive cells per HPF (magnification, ×400) (mean ± standard deviation), whereas sinusoidal endothelial cell (EC) responses are expressed as relative staining intensity. Comparable results were obtained with CF1 mice.

