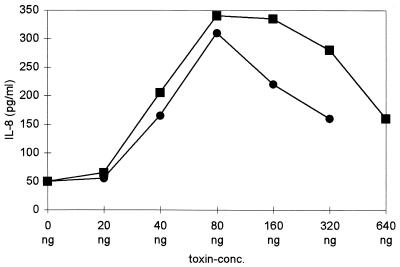
FIG. 5.
Dose-dependent response to alpha-toxin in ECV304 and THP-1 cells. IL-8 levels in supernatants were measured 24 h after toxin treatment (squares, THP-1; circles, ECV304). The bell-shaped dose-response curve and the maximum levels shown are representative (n = 7 for THP-1 cells, n = 5 for ECV304 cells). The lytic activity per nanogram of toxin varied between different toxin preparations; therefore, P values were calculated for the comparison of maxima in treated samples versus those of controls (see text).

