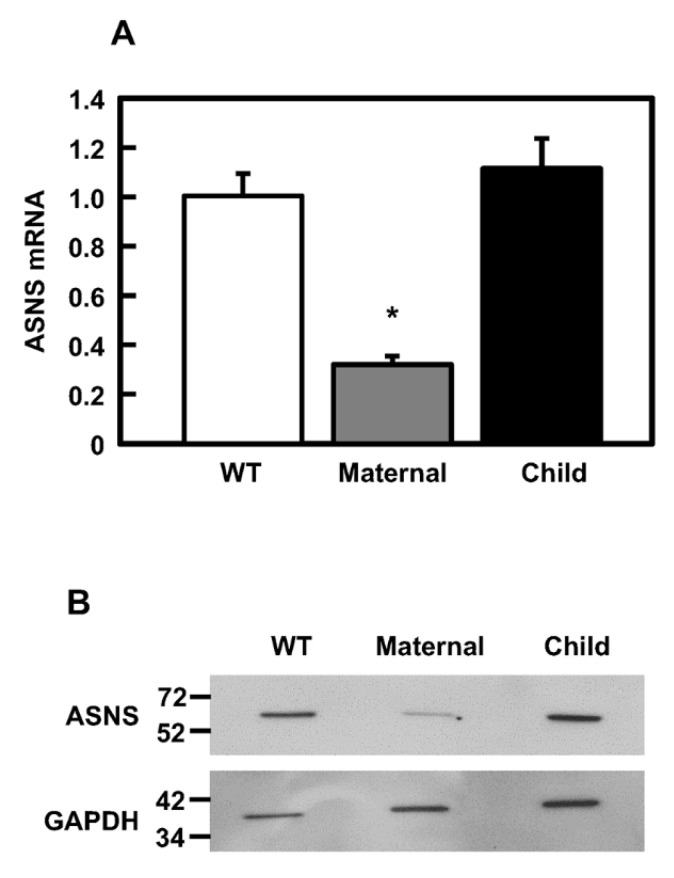
Figure 3.
ASNS mRNA and protein evaluation in fibroblasts. (A) ASNS mRNA abundance, normalized to GAPDH mRNA and plotted relative to WT, as detected by qRT-PCR for WT, maternal, and child fibroblasts. An asterisk indicates that the value is statistically different from the WT, with a p-value of ≤0.05. (B) Immunoblot for ASNS protein in WT, maternal, and child fibroblasts.

