Figure 3.
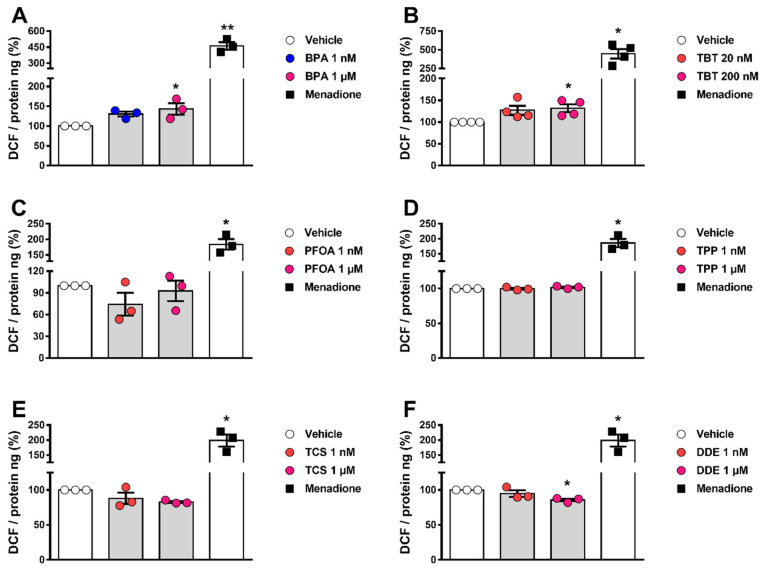
ROS production upon MDC exposure. αTC1-9 cells were treated with vehicle (DMSO) or different doses of BPA (A), TBT (B), PFOA (C), TPP (D), TCS (E), or DDE (F) for 24 h. Menadione (15 μM for 90 min) was used as a positive control. Generation of ROS was assessed by oxidation of the fluorescent probe DCF and normalized by total protein. Data are shown as means ± SEM (n = 3–4 independent experiments, where each dot represents an independent experiment). * p ≤ 0.05 and ** p ≤ 0.01 vs. vehicle. MDCs vs. vehicle by one-way ANOVA; menadione vs. vehicle by two-tailed Student’s t test.

