Figure 1.
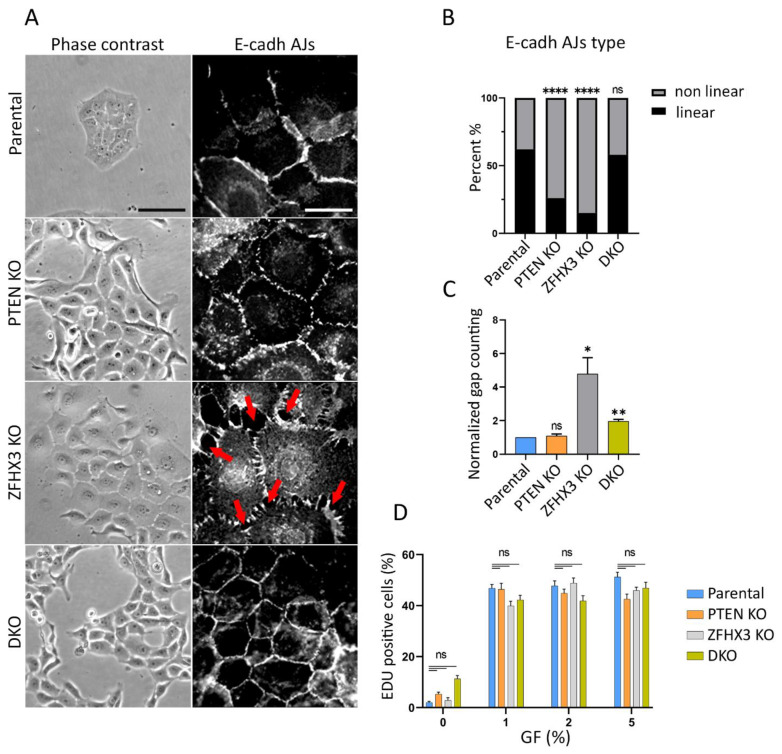
Effect of PTEN and ZFHX3 knockouts on morphology, cell–cell adherences and proliferation activity of MCF10A cells. (A) Phase contrast view and E-cadherin AJs (immunofluorescence) of cells cultivated in depleted medium (1% of horse serum) and no EGF (epidermal growth factor). Red arrows point to gaps between cells. Scale bars 100 μm for phase contrast pictures and 20 μm for immunofluorescence. (B) Quantification of E-cadherin linear and non-linear AJs within islets of parental and KOs cells. (C) Quantification of gaps between cells in cell islets. The data (B,C) represent 3 independent experiments, Sample size (the number of calculated AJs) for each experiment is: Parental 155, 114, 199; PTEN KO 86, 87, 159; ZFHX3 KO 98, 91, 161; DKO 136, 116, 189 junctions for (B,C). (D) Analysis of proliferation of obtained cells. The percentage of cells in S-phase was determined as a ratio of EdU—positive nuclei/DAPI-stained nuclei. The data represent 3 independent experiments. Measurements were performed from 6 different fields of view (N = 600−1000). Statistical analysis was performed by a contingency Chi square test in (B); unpaired t-test in panel (C), Kruskal–Wallis test in panel (D); * p < 0.05, ** p < 0.01, **** p < 0.0001 and ns: non-significant.

