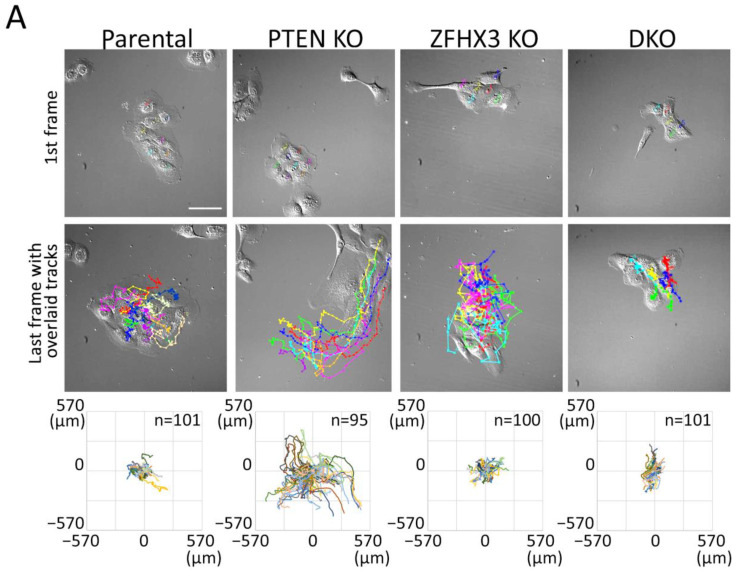
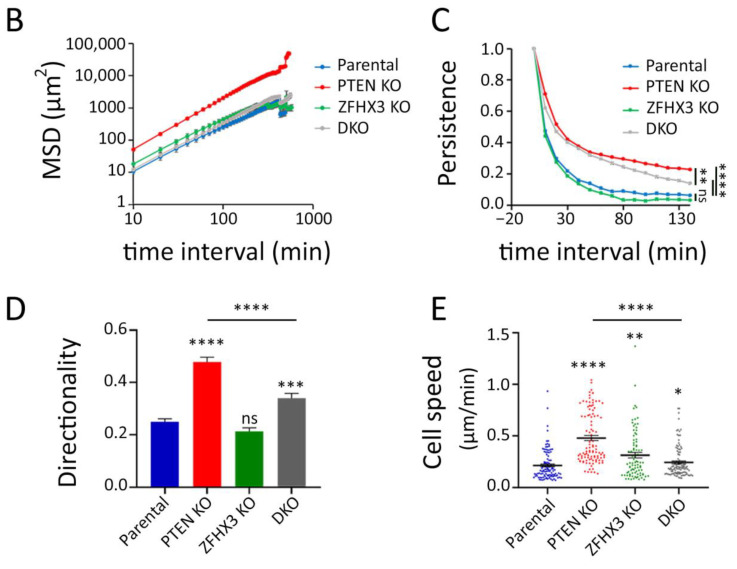
Figure 3.
Collective migration of gene-edited MCF10A cell lines in sparse culture. (A) First frames of video and last frames with cell trajectories. Scale bar: 100 μm. (B–E) Plots characterized the migration behavior of gene-edited MCF10A cells: (B) A log-log plot of mean square displacements (MSD); (C) migration persistence; (D) directionality ratio over elapsed time (16 h); (E) mean cell speed. Data from 3 independent experiments; more than 100 cells for each line were monitored. Mean ± SEM. Kruskal–Wallis test, * p < 0.05, ** p < 0.01, *** p < 0.001, **** p < 0.0001 and ns: non-significant.


