Figure 5.
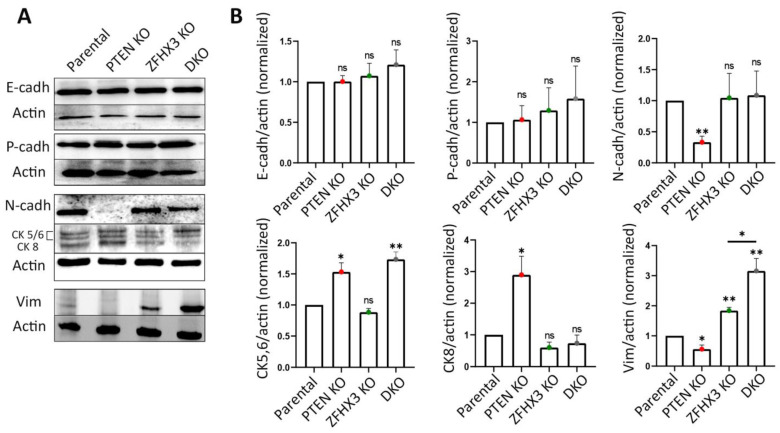
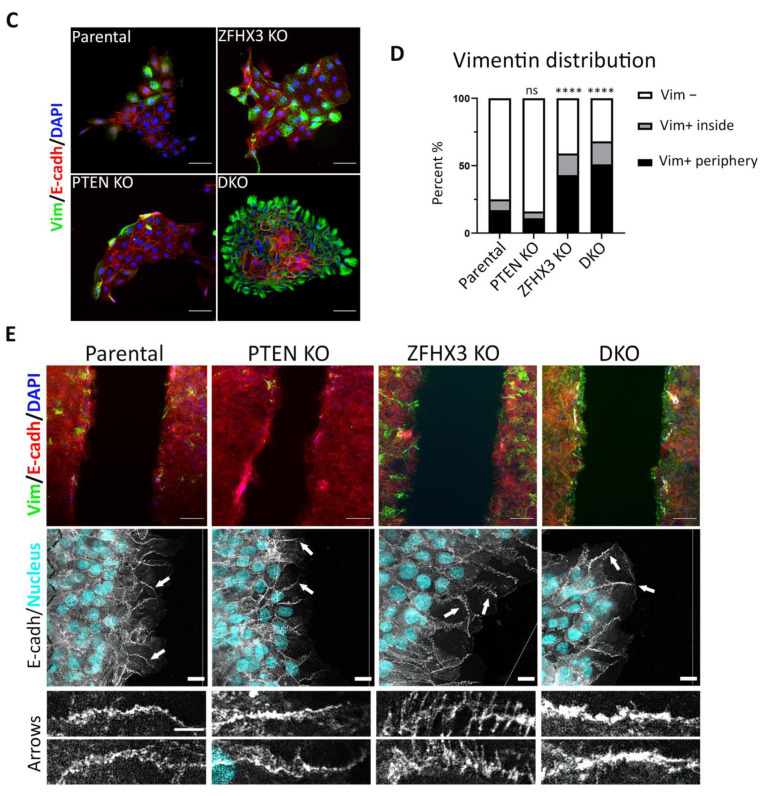
EMT features in gene-edited MCF10A cell lines. (A) Alteration of expression of E-, N- and P-cadherins; vimentin; and cytokeratins (5, 6, 8), and actin was used for normalization of protein loading (Western blots). (B) Quantification of Western blots by densitometry. Mean ± SEM from 3 independent experiments. (C) Immunofluorescence staining of islets for vimentin (green), E-cadherin (red) and nuclei (blue). Scale bars: 50 μm for islet images. (D) Quantification of vimentin-positive and -negative cells within islets or at their periphery. (E) Top images: immunofluorescence staining of wound edges for vimentin (green), E-cadherin (red) and nuclei (blue). Scale bars: 100 μm. Middle images: confocal microscopy of E-cadherin immunofluorescence in wound healing experiments. Nuclei are in cyan. Note the radial AJ in ZFHX3 KO. Arrows indicate the magnified junctions displayed below. Scale bars 18 μm for main immunofluorescence images and 5 μm for magnified junctions. Three independent experiments. Sample size (the number of calculated Vim+ cells) for each experiment is: parental 193, 236, 438; PTEN KO 190, 235, 481; ZFHX3 KO 150, 264, 424; DKO 250, 289, 356 cells for (D). Statistical analysis: unpaired t-test in panels (B); contingency Chi square test in (D); * p < 0.05, ** p < 0.01, **** p < 0.0001 and ns: non-significant.


