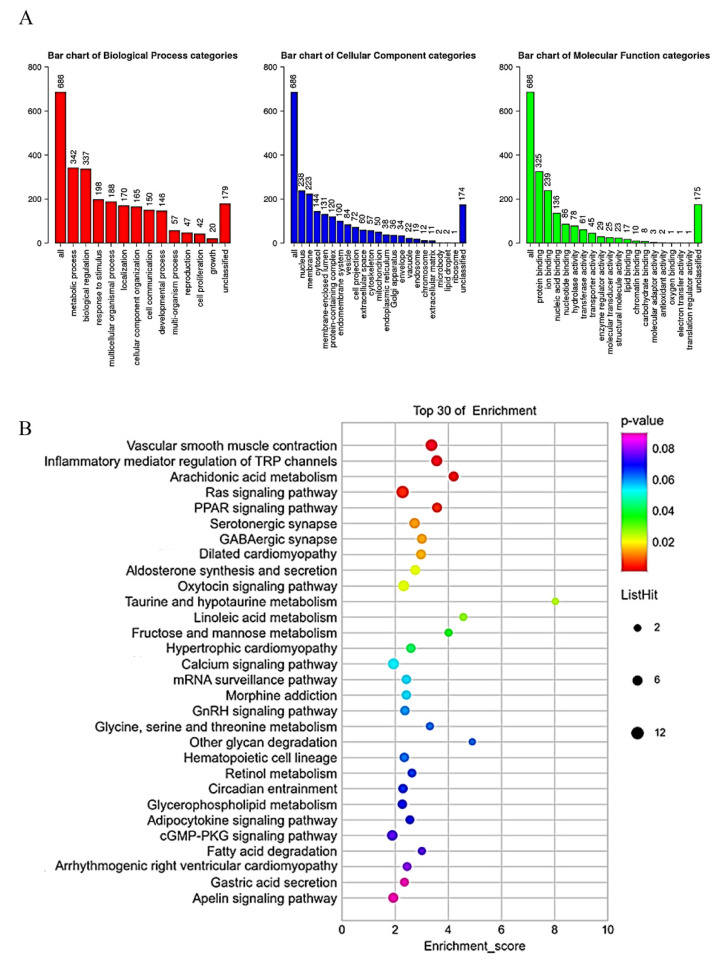
Figure 6.
GO and KEGG enrichment analysis of CYP3A43 co-expressed genes. (A) Gene ontology analysis of the genes co-expressed with CYP3A43 in LUAD. (B) Bubble plot for the KEGG analysis of the genes co-expressed with CYP3A43 in LUAD. Bubble color represents p value. Bubble diameter represents gene count.

