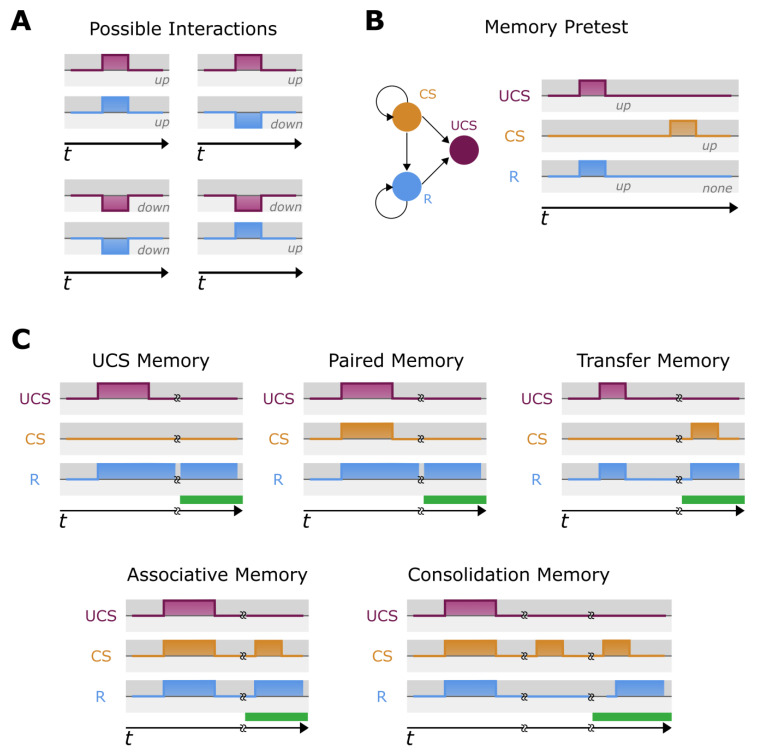
Figure 2.
Proposed memory types in biological networks. (A) Graphical representation of possible scenarios between UCS and R; an upregulation of UCS leads to upregulation of R, an upregulation of UCS leads to downregulation of R, a downregulation of UCS leads to downregulation of R, or downregulation of UCS leads to upregulation of R. Note that stimulation may be either upregulation or downregulation. Likewise, a response may be upregulation or downregulation. Note that while all responses have the same intensity, this is for visualization only. (B) The memory pretest for each potential memory circuit. First, UCS is stimulated, and the R node checked for response. Second, the chosen CS node is stimulated, and the R node is checked to ensure no response occurs. If any of these tests fail, the potential memory circuit is rejected. (C) The five tested memory phenotypes for all potential memory tests that pass the pretest (see description in Section 4). While responses are shown to be simultaneous this is not the case in normal biomodels, and we note that in this way for visual clarity only. Colors are matched to node identity and colors in the area under the stimulation or response are for visualization. The green bar represents the ‘test period’, where the desired memory responses is searched for after a stimulation of CS.

