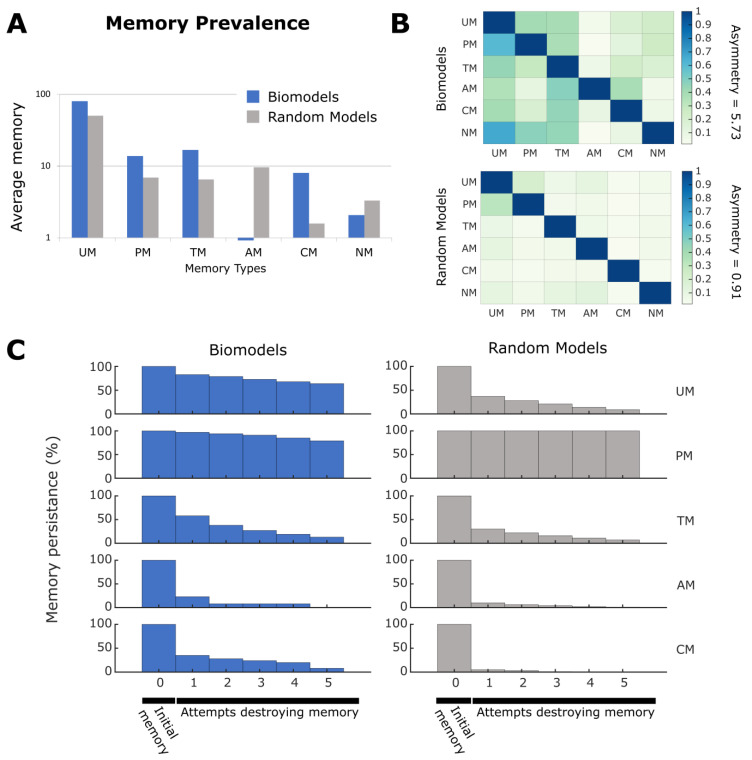
Figure 7.
Biological models have unique memory properties as compared to random models. (A) The overall memory prevalence across all 35 biological models and 2000 random models. All random networks are of network size 10 and having average connectivity of 40%, the same as network size and connectivity average found in all biological models. The x axis are different memory phenotypes tested and the y axis the percentage of potential memory models that demonstrated the specific phenotype. In all cases other than associative memory (AM), biological models showed more memory phenotypes than random networks. (B) The correlation matrixes for both biological and random models. The x axis and y axis are both memory phenotypes and the squares at their intersection report the mean correlation between the two memory phenotypes across all models. Next to each is the associated asymmetry measure, i.e., how asymmetrical these matrices are. (C) The memory persistence for both biological and random models as a function of number of edge perturbations to the network. Each perturbation both deleted and added a random edge to the network. The y axis reports the percentage of memory models that continue to show the memory phenotype after perturbation. For this, we considered only 26 biological models (due to size constraints in edge deletion) and 500 random models, with connectivity average (40%) and larger network size (14 nodes).

