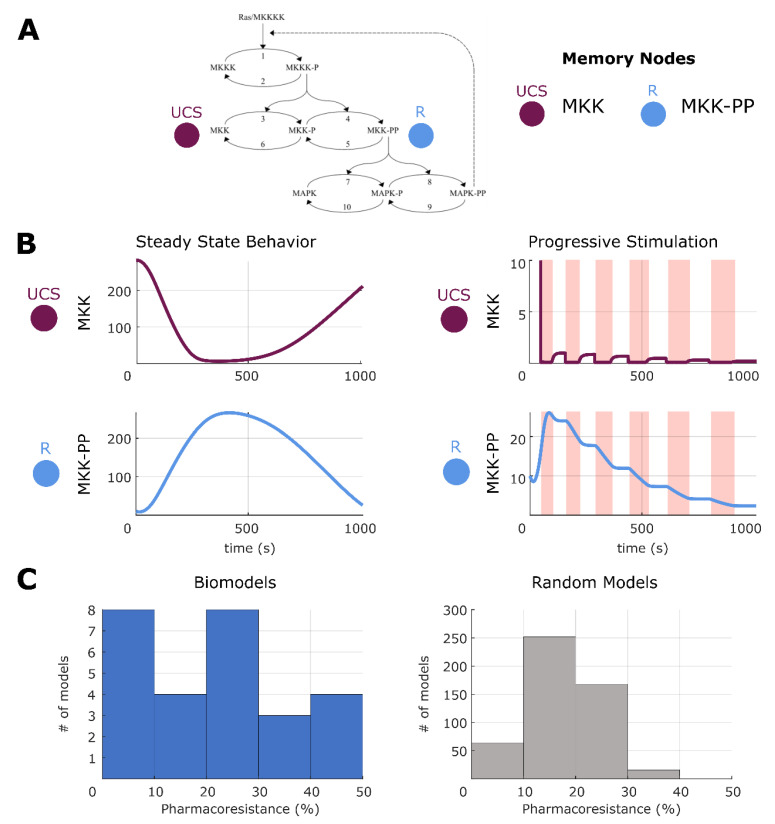
Figure 8.
Habituation upon repeated stimulation of UCS. (A) An example of habituation in a potential memory model built from [76] that passed the pretest. (B) On the left, the steady state of the network with no stimulation. On the right, an example of habituation. Progressive stimulation (downregulation, red shaded area) of UCS results in less and less response from R (upregulation to downregulation). (C) Distribution of pharmacoresistance across all biological models and random networks. The x axis is measured as the percentage of memory models for a given biological model that show habituation, or pharmacoresistance. We performed a Wilcoxon rank sum test applicable to un-equal samples to test the similarity of the distributions and while there are differences, they are not significantly different (p = 0.15).

