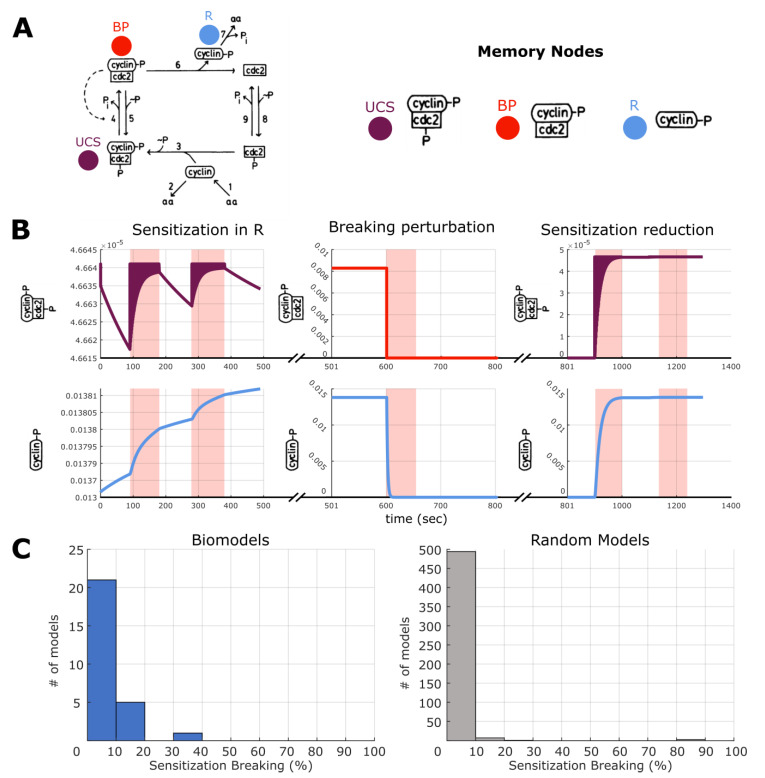
Figure 11.
Breaking sensitization. (A) An example potential memory model build from the biological model in [77] that shows both sensitization to stimulation as well as breaking of that sensitization through an alternative stimulation, a breaking perturbation (PB). (B) Time courses showing habituation (left), stimulation on the BP node (middle), and the subsequent sensitization breaking (right). All graphs are a part of the same simulation and separated for visualization only. Red shaded areas indicate when a stimulation was delivered, either on the UCS or BP node. (C) Distribution of sensitization breaking across all biological models and random networks. The x-axis is measured as the percentage of memory models for a given biological model that show sensitization breaking. We performed a Wilcoxon rank sum test applicable to un-equal samples to test the similarity of the distributions and they are significantly different (p = 2.17 × 10−45).

