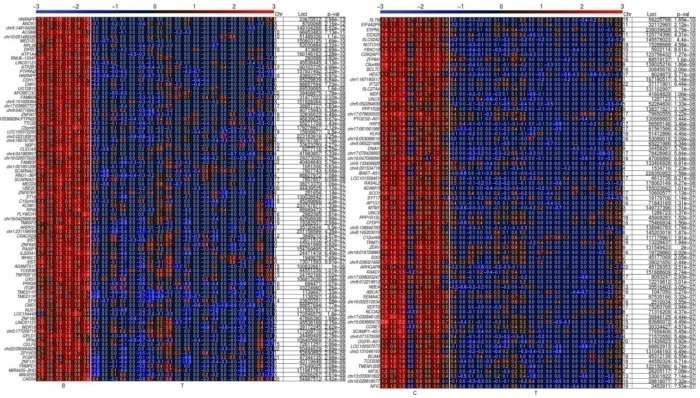
Figure 4.
DNA methylation heat maps of CpG-rich DNA probes of 60 nucleotides associated with 5′ gene regions in BPH, PCa-adjacent and PCa tissue samples. Both groups, firstly, 6 tissue samples from BPH prostate glands (B), and secondly, 8 samples of tumor-adjacent healthy-appearing gland tissue (C), were separately analyzed in comparison to the same 20 PCa tumor tissue samples (T). Only the first 75–85 most differentially methylated CpG-rich probes out of approx. 250 hypomethylated genetic regions found in each group are presented. Each rectangle in the heat map stands for one CpG-enriched 60-nucleotides-long probe associated with the named 5′ gene region, with the chromosomal location indicated on the right hand side (Chr, start/end). Redder colors correspond to more methylated regions. E.g., the most unmethylated 5′ gene regions are light blue. The grade of methylation is also indicated by numbers within the colored rectangles. A higher number corresponds to higher methylation.

