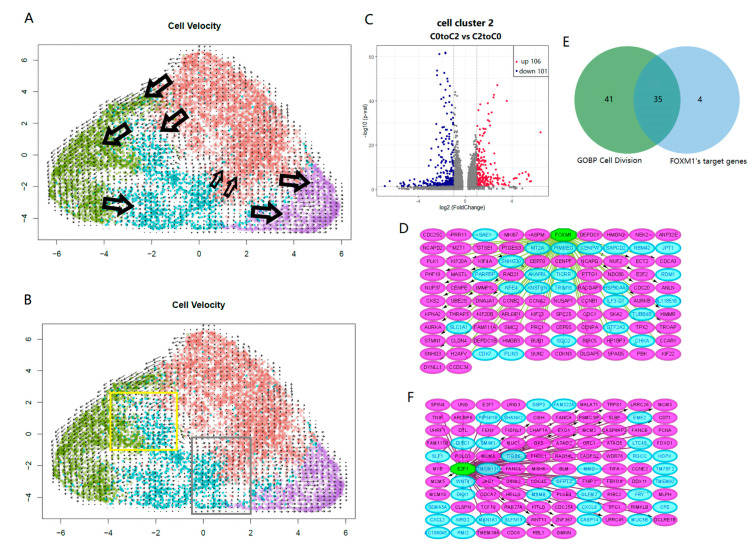
Figure 4.
UMAP projection shows the RNA velocity of four clusters in PC-9s, with C0, C1, C2 and C3 shown in brown, green, cyan and purple, respectively; and the arrows indicate the transformation between cell clusters (A). In the C2 group, “C0 to C2” transformed cell subsets and “C2 to C0” transformed cell subsets were extracted. Cells in yellow frame were “C0 to C2” and cells in grey frame were “C2 to C0” (B). Volcano plot displays DEGs between “C0 to C2” and “C2 to C0”; there are 106 up-regulated DEGs in red points and 101 down-regulated DEGs in blue points (|log2FC| > 1 and p-value < 0.05) (C). Directed graphs show two main TFs in “C2 to C0” and “C0 to C2”, respectively (D,F). Green hexagons represent TFs, pink ellipses represent targeted genes, and blue ellipses represent other down-regulated DEGs (D) or up-regulated DEGs (F) that (C) mentioned. Venn diagram displays the intersection between core genes in GO BP cell division and FOXM1’s targeted genes (E).

