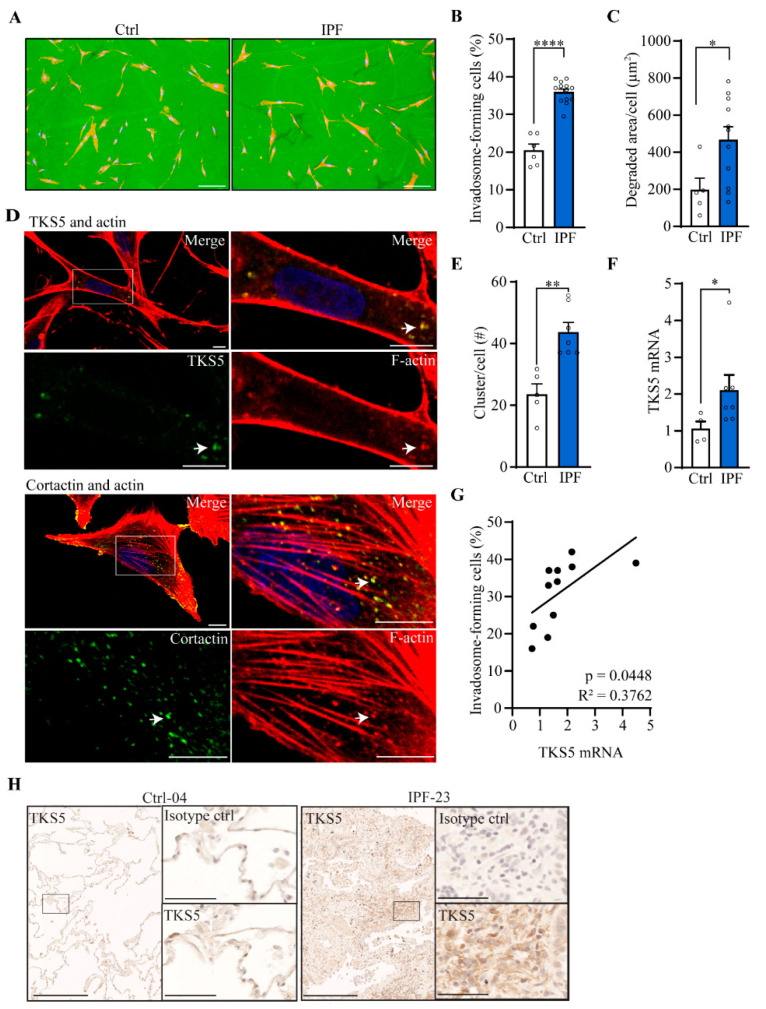
Figure 2.
Invadosome formation is increased in lung fibroblasts isolated from IPF patients. Invadosome formation was assessed in fibroblasts from healthy and IPF lung tissues. Each value in the histograms corresponds to a primary culture from one healthy or one IPF individual. (A) Representative images of control and IPF human fibroblasts plated on fluorescent gelatin showing nuclei (blue) and f-actin (red). The invadosome-mediated degradation areas appear as black holes in the green gelatin in close proximity to the cells. Scale bar = 100 µm. (B) The percentage of cells forming invadosomes (ctrl: n = 6, IPF: n = 13) and (C) the areas of degraded gelatin per cell were quantified (ctrl: n = 5, IPF: n = 11). (D) Confocal micrographs of IPF fibroblasts stained for f-actin (red), nucleus (blue) and TKS5 (upper image) or cortactin (lower image) in green. An invadosome-rich region is zoomed in and presented on the right. Scale bar = 10 µm. (E) The number of invadosomal structures identified by the colocalization of cortactin and actin was counted per cell (ctrl: n = 5, IPF: n = 7). (F) mRNA level of TKS5 was measured (ctrl: n = 4, IPF: n = 7). (G) The levels of TKS5 mRNA expression were correlated with the percentage of invadosome-forming fibroblasts (n = 11). (H) Representative immunohistochemistry staining of TKS5 in healthy (n = 3) and IPF (n = 4) lungs. Scale bar = 250 µm. A region of interest is zoomed in and presented on the right with corresponding isotype control. Scale bar = 50 µm. * p < 0.05, ** p < 0.01, **** p < 0.0001.

