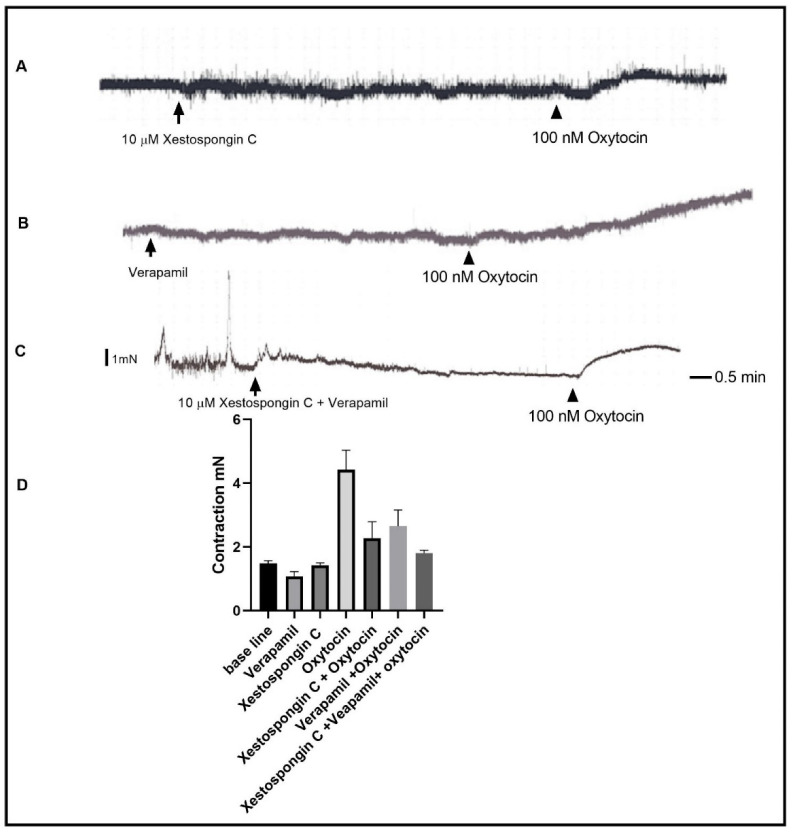
Figure 4.
Effect of blocking IP3 receptor and VGCC on oxytocin-induced contraction. (A) is a representative trace demonstrating 100 nM oxytocin self-induced contraction after 15 min of incubation with 10 µM of Xestospongin C. It also shows that Xestospongin C did not affect the baseline activity. (B) is a representative trace demonstrating 100 nM oxytocin-induced contraction after 15 min of incubation with 10 µM of verapamil. It also shows the verapamil effect on the baseline activity. (C) is a representative trace demonstrating 100 nM oxytocin-induced contraction after 15 min of incubation with both 10 µM of Xestospongin C and 10 µM of Verapamil. It also shows the effect on basal activity. (D) is a summary graph showing that oxytocin-induced contraction is significantly inhibited by Xestospongin C and by Verapamil and that the inhibition was greater when both agents were used. Data expression is in mN of force. Values are mean ± SEM. n = 7.

