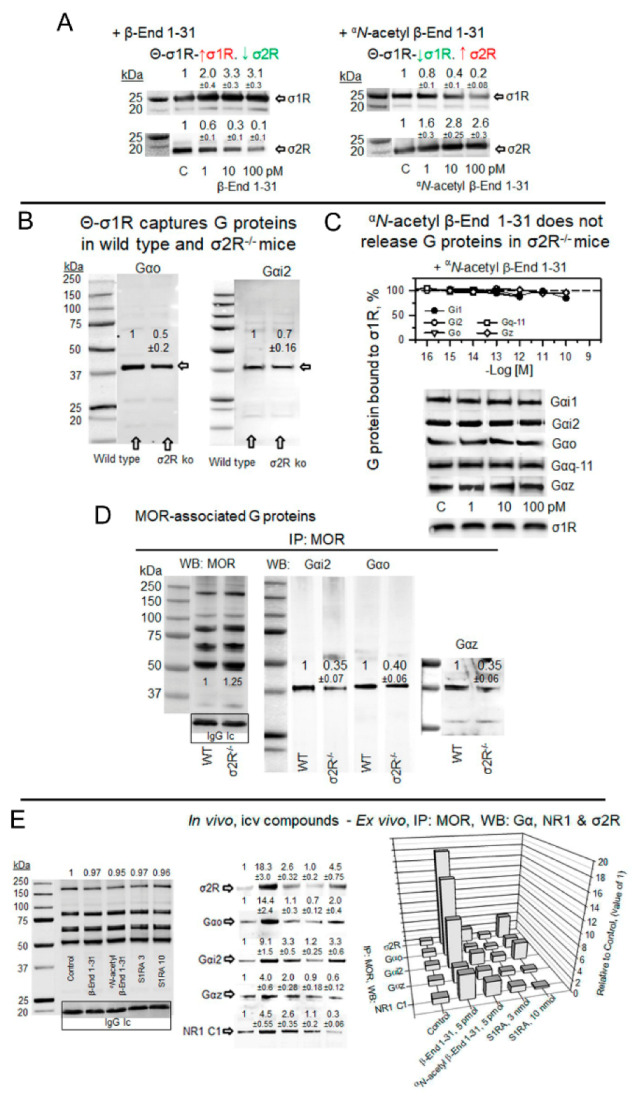
Figure 5.

αN-acetyl β-End 1–31 promoted and β-End 1–31 reduced the exchange of G proteins for σ2Rs in σ1R oligomers. Implications in MOR signaling. (A) Effect of β-End 1–31 and αN-acetyl β-End 1–31 on the association of σ1R and σ2R from mouse cerebral cortex with agarose-σ1R oligomers. Details are shown in Figure 4C,D. β-End 1–31 increased the presence of σ1R but diminished the σ2R association. In contrast, αN-acetyl β-endorphin 1–31 dissociated the σ1R but promoted the σ2R association. The σ1R and σ2R immunosignals obtained in the absence of β-End 1–31 and αN-acetyl β-End 1–31 were used as control (C, assigned an arbitrary value of 1) to which we referred those observed in the presence of increasing concentrations of the pituitary peptides. (B) Θ-σ1R captured G proteins in CD1 wild-type and σ2R−/− SBM. Ex vivo fishing assays were performed as described in Figure 4C. The data from σ2R−/− solubilized cortical tissue were referred to the wild-type control (arbitrary value of 1). (C) The σ1R oligomers captured G proteins from σ2R−/− mouse SBM. For each Gα subunit and the σ1R, the immunosignals in the absence of the acetylated peptide were the controls (C, value of 1). In this scenario, αN-acetyl β-End 1–31 did not produce significant alterations and thus failed to release G proteins and σ1Rs from σ1R oligomers. (D) Coprecipitation of G proteins with MORs in CD1 wild-type and σ2R−/− mice. MORs were immunoprecipitated (IP) from mouse SBM. Coprecipitated proteins were detached from MORs and analyzed by Western blotting with antibodies directed to Gαi2, Gαo, Gαz and MOR proteins. (E) Effect of in vivo icv injection of β-End 1–31, αN-acetyl β-End 1–31 and S1RA on the association of PAG MORs with G proteins, σ2Rs and NMDAR NR1 C1 subunits. β-End 1–31 (5 pmol), αN-acetyl β-End 1–31 (5 pmol) and S1RA (3 nmol and 10 nmol) were icv-injected, and the mice were sacrificed 60 min post-treatment to obtain the PAG synaptosomal fraction. The MORs were immunoprecipitated from the solubilized membrane preparations, and the coprecipitated target proteins were analyzed by Western blotting. Further details are provided in the Section 4 and Figure 4B. Representative blots are shown. The immunosignal provided by the light chain of the affinity-purified anti MOR IgGs was used as SDS-PAGE loading control. No significant differences were observed between IP MORs corresponding to control and treatments. Thus, for each in vivo treatment, the immunosignals of the different Gα subunits and the NR1 C1 protein coprecipitated with MORs were referred to as the saline control group (assigned an arbitrary value of 1). (A,B,D,E) Data are the mean ± SD, n = 3. Data were analyzed by pairwise Holm–Sidak multiple comparison tests following ANOVA: p < 0.05, 1-β > 0.80.
