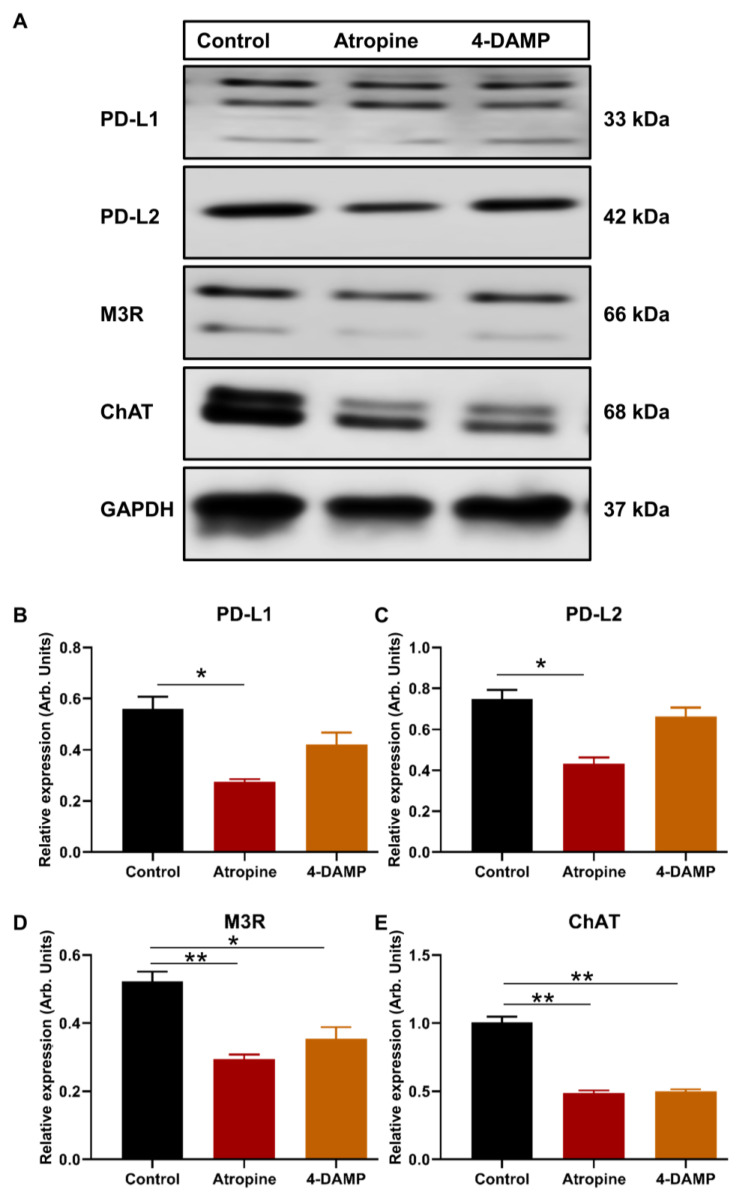
Figure 2.
Effect of atropine and 4-DAMP on the expression of immunosuppressive and cholinergic markers in CT-26 cells. Western blot bands for PD-L1 and PD-L2 expression in CT-26 cells treated with atropine and 4-DAMP (A). Western blot bands for M3R and ChAT expression in CT-26 cells treated with atropine and 4-DAMP (A). Bar graphs displaying the mean intensity of PD-L1 (B) and PD-L2 (C) expression in CT-26 cells treated with 4-DAMP and atropine. Bar graphs displaying the mean intensity of M3R (D) and ChAT (E) expression in CT-26 cells treated with 4-DAMP and atropine. Data presented as mean ± SEM. Two-way ANOVA, * p < 0.05, ** p < 0.01. Data presented as mean ± SEM. Two-way ANOVA, * p < 0.05.

