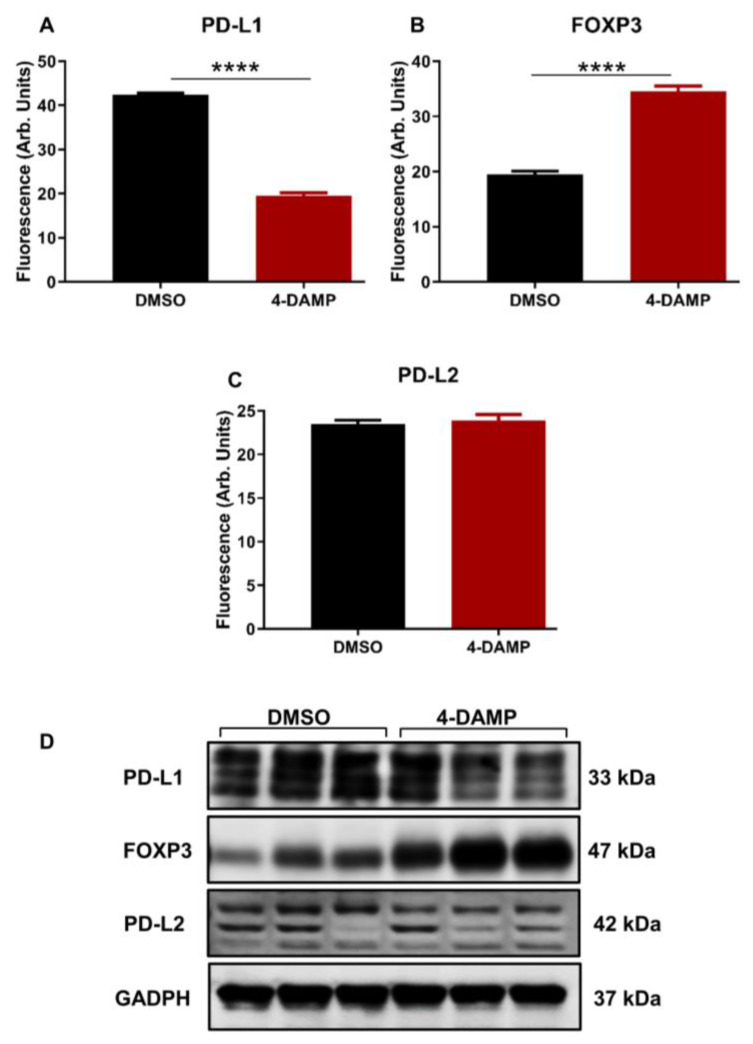
Figure 5.
Effect of 4-DAMP on the expression of PD-L1 and FOXP3 in vivo. Bar graphs displaying the mean fluorescence of PD-L1 (A), FOXP3 (B), PD-L2 (C), and images of Western blot bands (D) in tumor samples from DMSO-treated and 4-DAMP-treated mice. Data presented as mean ± SEM, n = 8 mice per group. Student’s t-test, **** p < 0.0001.

