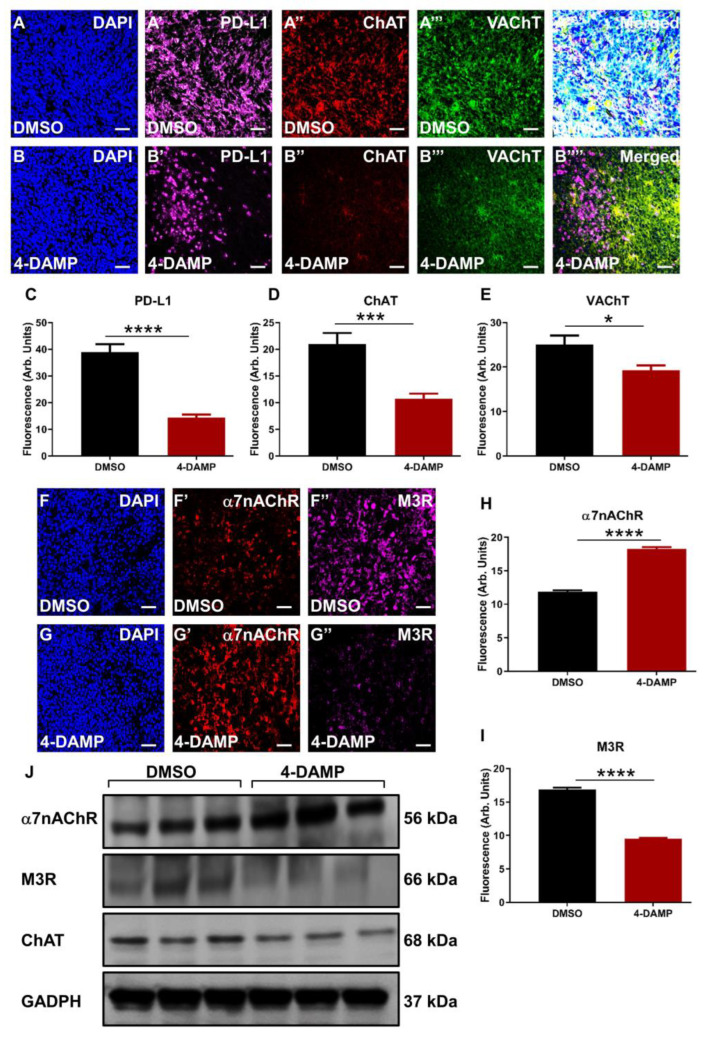
Figure 6.
Correlation of PD-L1 expression with cholinergic markers in tumor samples from mice bearing CT-26 cell-induced tumors. Expression of PD-L1 and cholinergic markers (ChAT and VAChT) in tumor samples from mice bearing CT-26 cell-induced CRC treated with DMSO (A–A’’’’) and 4-DAMP (B–B’’’’). Tumors were labeled with the nuclei marker DAPI (blue; A-B), PD-L1 (magenta; A’-B’), ChAT (red; A’’,B’’), VAChT (green; A’’’,B’’’), and all markers merged (A’’’’,B’’’’). Bar graphs displaying the mean fluorescence of PD-L1 (C), ChAT (D), and VAChT (E) in tumor samples from DMSO-treated and 4-DAMP-treated mice. Expression of cholinergic markers in tumor samples from mice bearing CT-26 cell-induced CRC treated with DMSO (F–F’’) and 4-DAMP (G–G’’). Tumors were labeled with the nuclei marker DAPI (blue; F,G), α7nAChR (red; F’,G’), and M3R (magenta; F’’,G’’). Bar graphs displaying the mean fluorescence of α7nAChR (H), M3R (I), and Western blot bands (J) in tumor samples from DMSO-treated and 4-DAMP-treated mice. The scale bar represents 50 µm. Data presented as mean ± SEM, n = 8 mice per group. Student’s t-test, * p < 0.05, *** p < 0.001, **** p < 0.0001.

