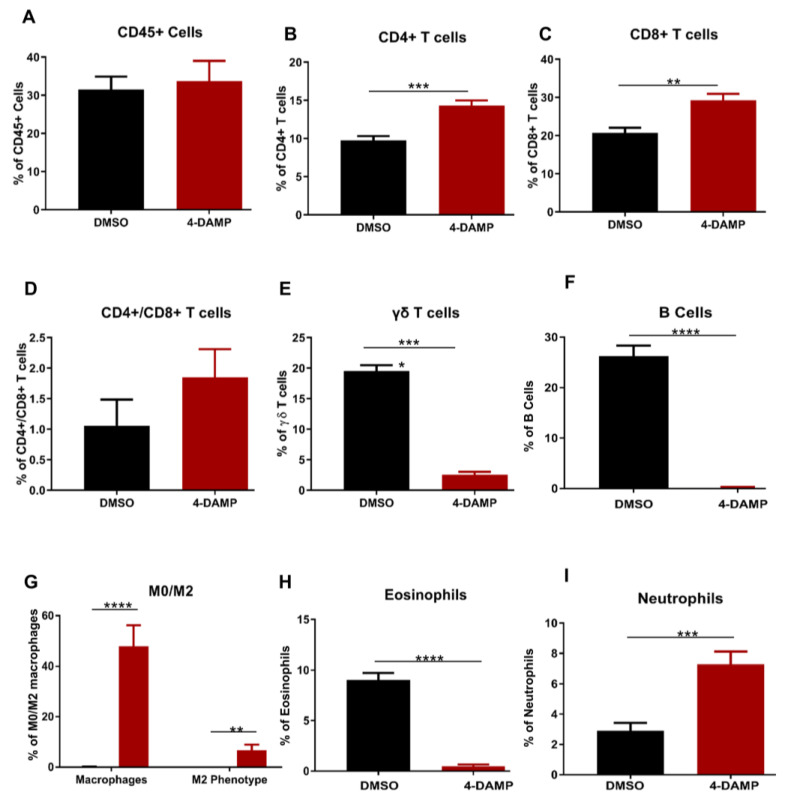
Figure 7.
Flow cytometric analysis of CD45+ cells and T lymphocytes. Proportion of the CD45+ cells (A), CD4+ T cells (B), CD8+ T cells (C), CD4+/CD8+ T cells ratio (D), γδ T cells (E), B cells (F), eosinophils (G), macrophages (H) and neutrophils (I) in tumors from DMSO-treated and 4-DAMP-treated groups. Data presented as mean ± SEM, DMSO-treated (n = 4), 4-DAMP-treated (n = 7) mice per group. Student’s t-test, ** p < 0.01, *** p < 0.001, **** p < 0.0001.

